Can AI Stand In for Human Survey-Takers? “Not Really” — but Not Nothing Either
Pew Research Center has published one of the most thorough public evaluations of synthetic samples to date, and its verdict is clear: AI cannot stand in for human survey-takers. The verdict holds. But it answers one question, and Pew's own published data answer a second one.
On 30 September, Pew Research Center published “Can AI Stand In for Human Survey-Takers? Not Really”. It is one of the most thorough public evaluations of synthetic samples to date, and its verdict is clear. That verdict holds. But it answers one question, and Pew’s own published data answer a second one.
What Pew did
Pew gave each panelist whose survey it replicated an AI counterpart: one digital twinper real respondent, not a generic persona drawn from population averages. The twins took three waves of Pew’s national probability panel, the American Trends Panel, close to 300 questions in all, with the same instructions and the same question order as the humans.
Before the main runs, Pew held a small tournament to choose the setup, and published the results. Testing on OpenAI’s GPT-5.1, the error was 16.0 points with a standard demographic profile, 13.7 with an extended profile, and 13.1 once a short written summary of each profile was added. With that setup, Anthropic’s Claude Opus 4.6 scored 11.4 and the lightweight GPT-5 nano 17.4. Opus 4.6, used for most of the results, stopped learning in May 2025, so it could not have seen the 2026 answers.
Most important of all, Pew published the complete comparison: question by question, option by option, humans and synthetics side by side. That lets anyone redo the arithmetic, including calculations Pew did not run.
The verdict, and why it stands
The headline findings, for Opus 4.6 on the questions Pew tested, leave little room for argument:
- 12 points of average error per answer option, and more than 15 points on 28% of questions.
- Too much knowledge. The twins answered factual questions correctly about 80% of the time; real people, about half the time.
- Too little doubt.Humans chose “not sure” 16% of the time, the twins 4%, even though their instructions said it was fine not to know.
- Empty answers. 47% of synthetic questions had at least one option that no twin chose. Not a single human question did.
Anyone selling a synthetic panel on the promise of publishable percentages now has to answer this study.
What the metric measures, and what it leaves open
Pew’s metric compares two distributions, question by question: is the share of people choosing each option right? That is exactly what Pew needs, because its job is to publish estimates of public opinion. If you report “37% approve” and you are nine points out, you have failed.
So the metric answers one question: can a synthetic sample replace a human sample when the goal is to publish a percentage? The answer is no. It does not answer a second question: is there usable information in these answers for other purposes? Three features of the metric explain why that second question stays open.
- It looks only at percentages. That is the right test before publishing a figure. It does not tell you whether the answers point the right way, or rank things in the right order.
- Its scale depends on the number of answer options. The same disagreement scores higher on a three-option question than on a five-option one. That makes it hard to compare scores from one type of question to another.
- It has no reference point.Two good human samples would not match perfectly either, but the report does not say how far apart they would be. Without that benchmark, “twelve points” is hard to judge.
None of this weakens Pew’s conclusion. It means the report answers one question very well, and leaves another one open.
What else the report teaches
What you feed the model matters, and so does the model itself. A richer profile cuts the error from 16.0 to 13.1 points; changing the model moves it between 11.4 and 17.4. Pew also shows that two leading models distort opinion in opposite directions: one makes the public look more extreme than it is, the other more centrist. Any claim that synthetic data “works” or “doesn’t work” without naming the model and the profile tells you very little.
The pull toward the typical answer is measured precisely. On 66% of synthetic questions, at least one option was chosen by fewer than 1% of the twins; that happened on 1% of human questions. This is often called under-dispersion, and it is the most useful diagnosis in the report.
It shows where to be most careful.The model struggled especially, though not only, with situations that developed after it stopped learning. And on Pew’s 120-plus trend questions, the average error was the same whether or not real opinion had moved: no sign that the method picks up change better where there is change to pick up.
A second question for the same data
Because Pew published the full comparison, anyone can ask a different question. Not “is the percentage right?” but “does it point the right way, and does it put things in the right order?” That is the question behind many research decisions: which barrier matters most, which country is seen most favourably, which attribute fits a brand best.
Laurent Florès, FlashInsight’s founder, ran those calculations on Pew’s published figures and set them out in a LinkedIn article. They are exploratory, and cover the one model behind most of Pew’s results:
- The direction is right more than nine times out of ten. On the 236 questions with an ordered scale, the synthetic majority falls on the same side as the human majority.
- The order across questions is largely preserved. Questions that score higher with humans tend to score higher with the twins: the correlation between the two sets of average scores is about 0.9.
- Rankings within lists mostly hold. Across the 20 lists of four or more items (national problems, countries, leaders, concerns), none shows human and synthetic rankings running in opposite directions, and 17 of the 20 show a strong match. The median rank correlation is 0.85, where two human samples would reach about 0.98: largely kept, with a measurable loss.
The same data also confirm Pew’s verdict:
- The podium does not hold. The item ranked first is the right one only about half the time.
- Percentages are off. On the 39 two-option questions, the majority share is about 13 points out on average, and only around one in five lands within five points.
The synthetic sample that is “twelve points off” mostly gets the order of priorities right, and mostly gets the numbers wrong.
What to keep, what to throw out
On this evidence, which is one model on one set of questions:
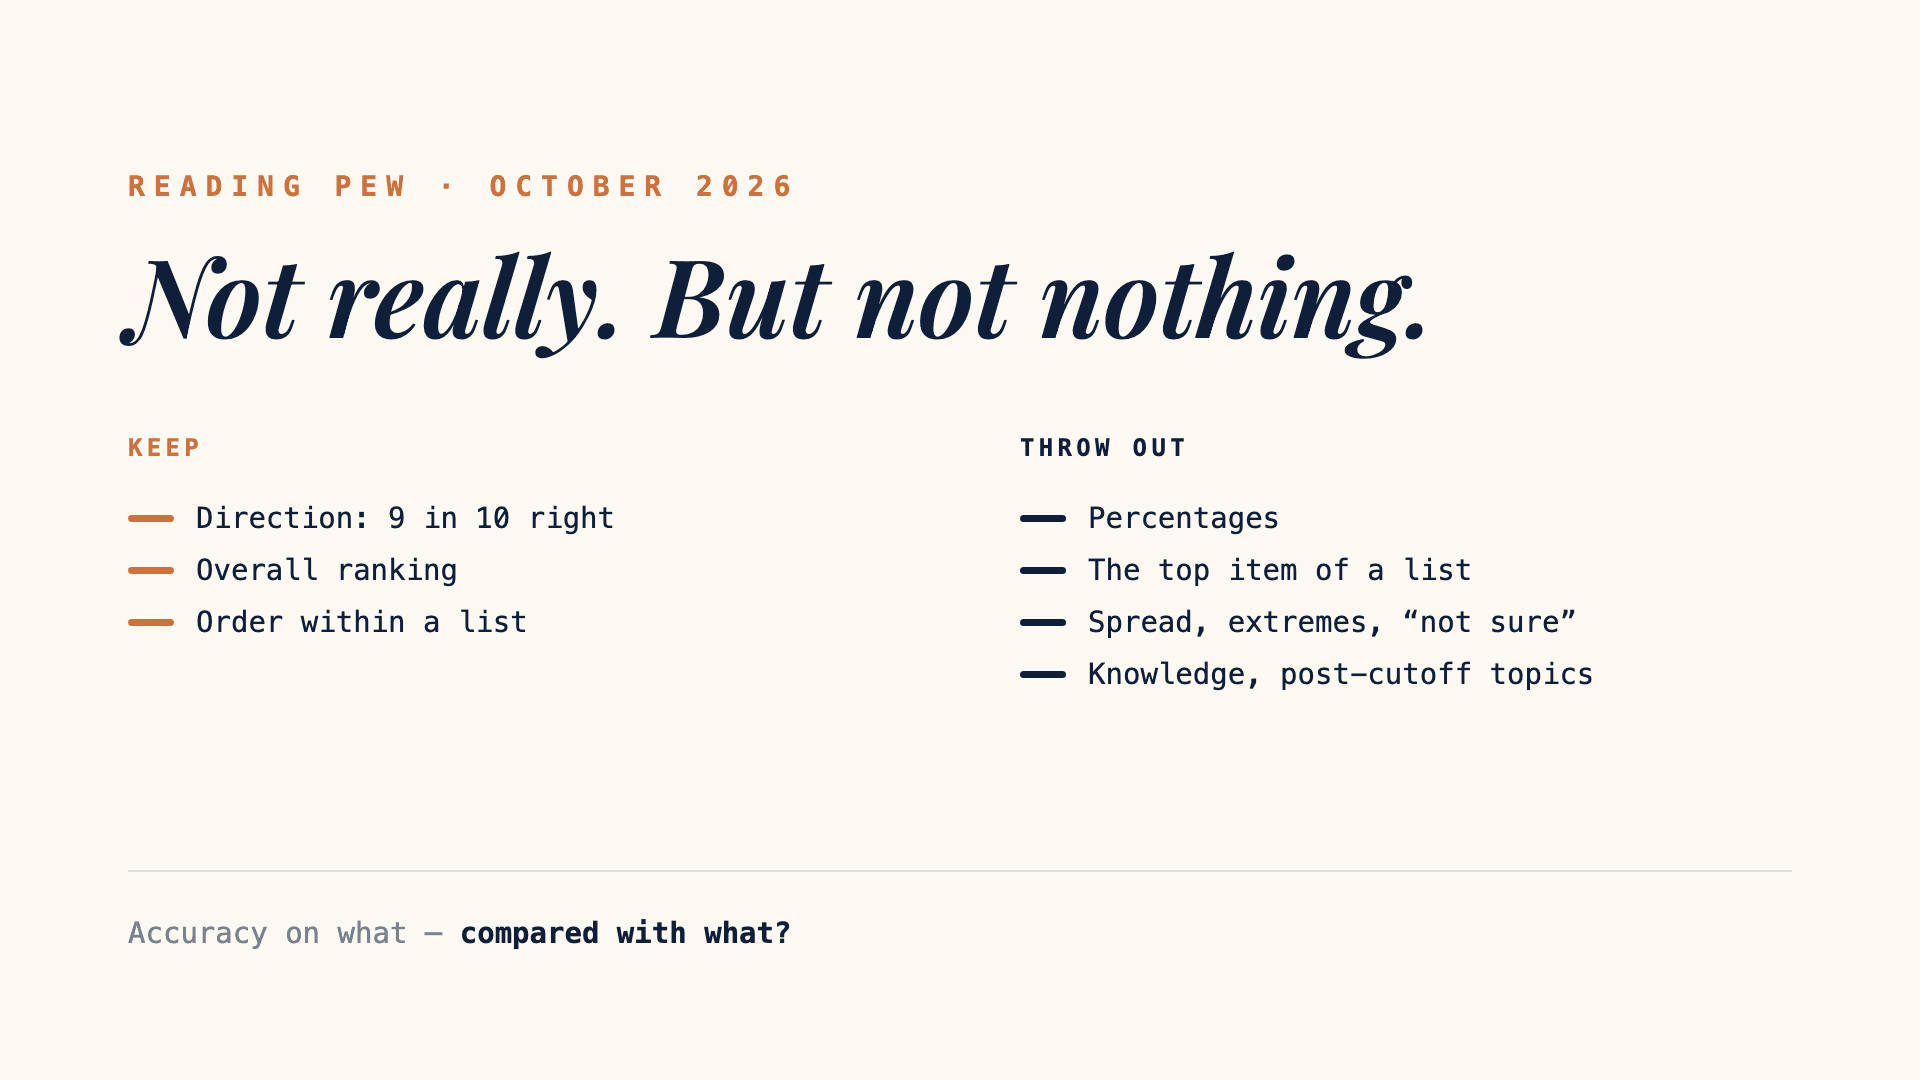
Worth keeping: the direction, and the overall ranking.
Not to be trusted:percentages; the top item of a list; the spread of opinion, meaning extremes, “don’t know” answers and confidence intervals; knowledge and awareness questions. Topics that emerged after the model stopped learning call for a human sample alongside.
For research buyers, that points to a working hypothesis rather than a proven rule, to be tested again whenever the model changes, and on their own kind of questions: Pew’s were about public opinion. Comparative decisions look like the more promising use: which concept, which message, which segment. Threshold decisionsare not: nothing here supports answering “we launch if 40% are interested” with a synthetic sample. And the right question to ask any supplier is: accuracy on what, compared with what?
One request to Pew
The report publishes overall distributions. The answers twin by twin are not released, so the question that matters most for commercial use cannot be answered yet: are the differences between groups right? The group figures Pew does publish call for caution: Republicans (16.1 points of error) and Black adults (15.1) fare worst, against 12.4 overall. Releasing the individual answers, even a sample of them, would let researchers on every side work on that question with Pew’s data instead of arguing about averages. Laurent Florès has offered to work on them with Pew’s team.
A word on method
Figures attributed to Pew come from its published report and comparison tables. The direction, ranking and yes/no figures come from the re-analysis of those same tables. That re-analysis is exploratory, was not registered in advance, and covers one model on one set of questions; Pew itself shows that another model behaves differently. They say nothing about differences between groups, since the individual answers are not public. The method, code and data are available on request.
That is perhaps the best tribute to this report: it gives the whole profession the means to measure, rather than to believe or to dismiss.
Questions
What did Pew's study on AI survey-takers find?
Pew Research Center had an AI model answer three of its American Trends Panel surveys, close to 300 questions, as digital twins of the real panelists. In its main runs, with Claude Opus 4.6, the AI estimates differed from the human results by 12 percentage points on average, by more than 15 points on 28% of questions, and were especially wrong for some groups, including Republicans and Black adults. Pew concludes that AI polling is not a replacement for surveying real people.
What is a digital twin in the Pew study?
Each panelist whose survey was replicated got an AI counterpart built from that person's own data: demographics, past votes, and 71 additional variables from Pew's 2025 political typology survey, plus a short model-written summary of the profile. The twin then took the same survey as the person, question by question, with the same instructions.
Can synthetic respondents replace public opinion polls?
No. In Pew's study, synthetic percentages were not reliable enough to treat as estimates of public opinion: they were often far off, rarely said "not sure", left whole answer options empty, and knew more than real people do. Nothing in the study supports using a synthetic sample to report what share of the public thinks something.
Is there anything synthetic samples got right in the Pew data?
An exploratory re-analysis of Pew's published topline suggests yes, on a different question. On 236 scaled questions, the synthetic majority fell on the same side as the human majority more than nine times out of ten, and questions that scored higher with humans tended to score higher with the twins (correlation about 0.9). Across 20 lists of four or more items, none showed a negative relationship between human and synthetic rankings, and 17 of the 20 showed a strong one. The item ranked first, however, was right only about half the time, and percentages stayed off. The calculations cover one model on one set of questions.
What should I ask a synthetic panel vendor after the Pew study?
Ask what their accuracy figure is measured on, and compared with what. A figure on averages does not by itself show the spread of opinion, and a correlation means little without saying what level two human samples would reach. The Pew data were about public opinion, not concepts or messages, but they suggest comparing options is a more promising use than threshold decisions such as launching if 40% are interested. That is a hypothesis to test, again for each model.
Neither throw it all out nor keep it all: measure, and say on what.
Sources
Pew Research Center, “Can AI Stand In for Human Survey-Takers? Not Really”, 30 September 2026, report and comparison topline. Laurent Florès, “Can AI Stand In for Human Survey-Takers? ‘Not really’ — but not nothing either”, LinkedIn, 3 October 2026.
More common questions about synthetic respondents are answered in our FAQ.