85% of What? The Number the Synthetic-Research Market Keeps Getting Wrong
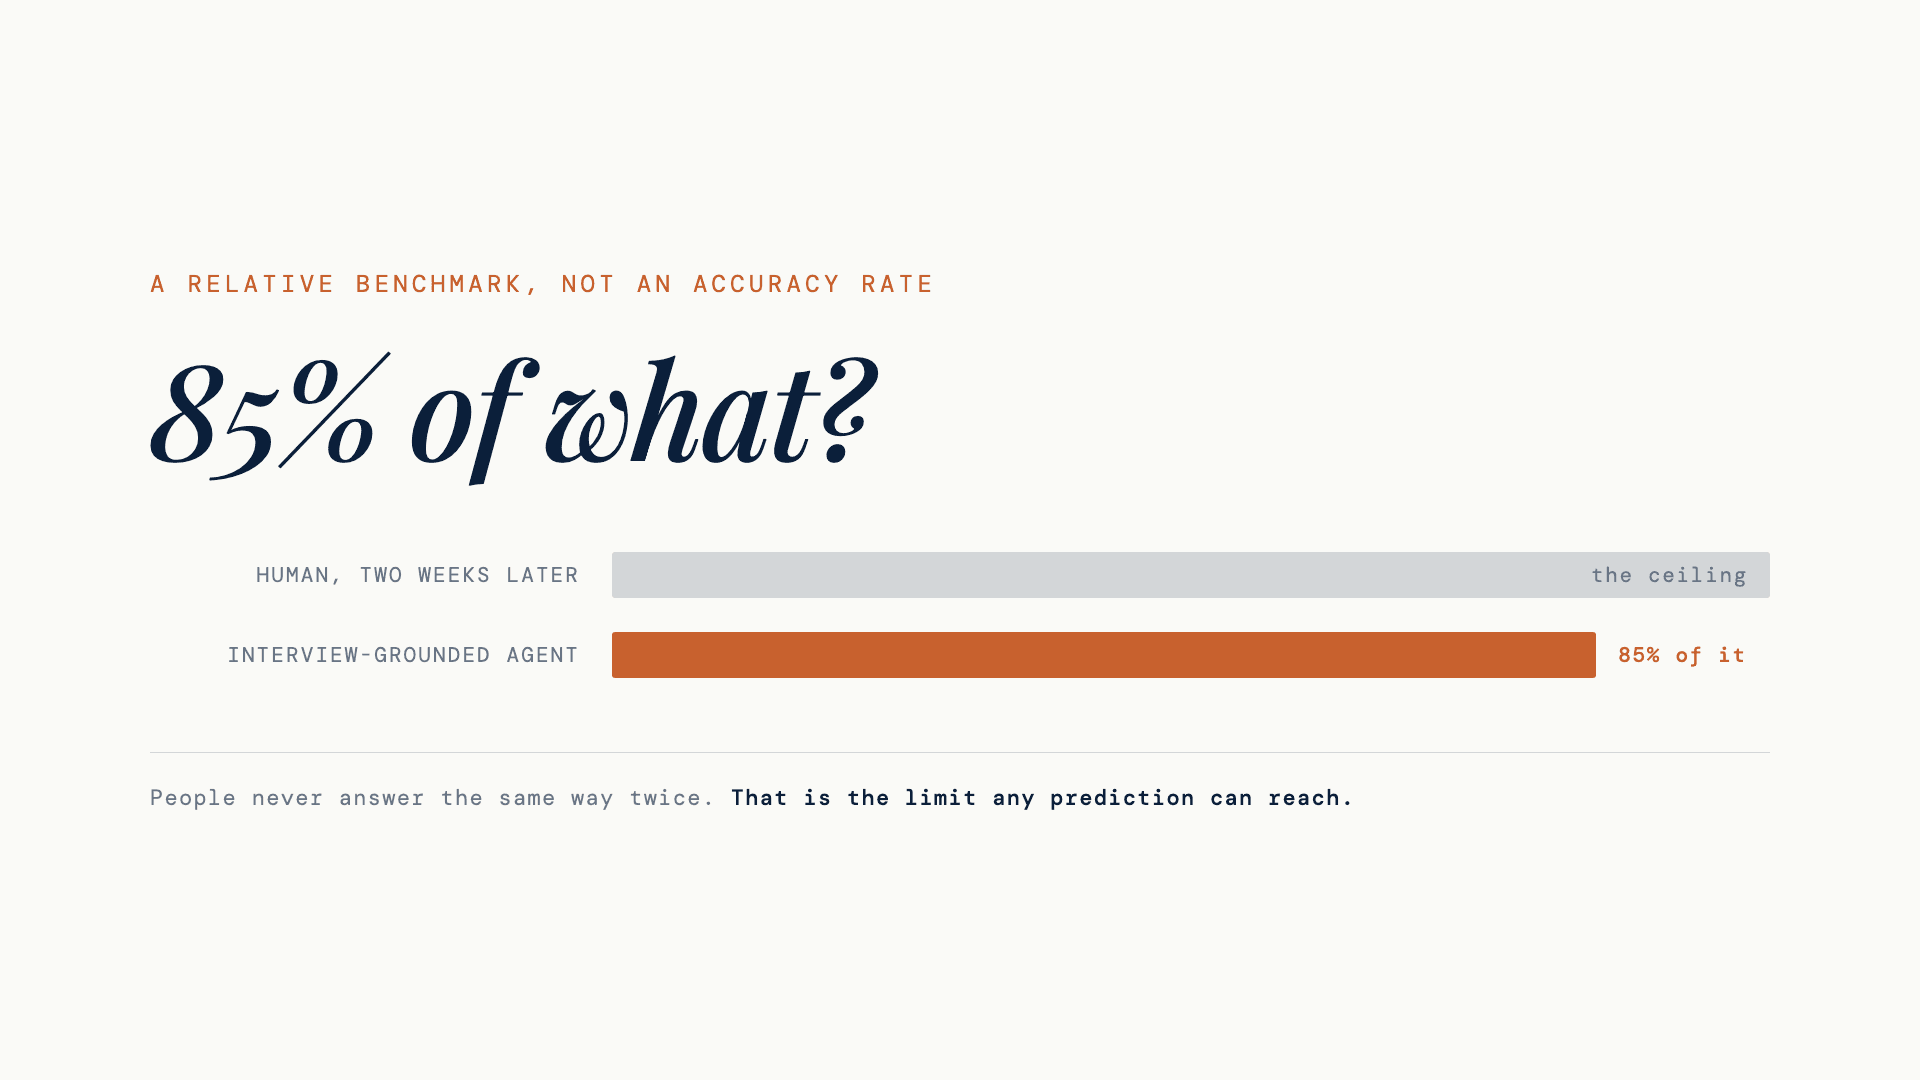
One figure has become the industry's shorthand for “synthetic respondents work”: 85%. It comes from a serious study, and it does not mean what the market has made it mean. It is not 85% accuracy — it is 85% of the consistency people manage with themselves. That distinction changes what you can reasonably buy.
One number has become the industry’s shorthand for “synthetic respondents work”: 85%. You will find it on vendor home pages, in the trade press, and in a great many pitch decks. It comes from a real study, and a good one. But it does not mean what it is being made to mean — and the gap is not a technicality. It is the difference between a modest, honest claim and a promise nobody has earned.
Where the number comes from
The source is Park et al. (2024), originally published as “Generative Agent Simulations of 1,000 People”, later retitled “LLM Agents Grounded in Self-Reports Enable General-Purpose Simulation of Individuals.” The work was done at Stanford, with sociologists from Princeton, using interview protocols from the American Voices Project.
The method was demanding, and worth describing, because almost nobody who quotes the headline number describes it. The researchers recruited 1,052 US adults, sampled to be representative on age, gender, race, education, income and state. Each participant sat through a two-hour, voice-to-voice semi-structured interview. An agent was then built from that person’s transcript — one agent per human, grounded in that human’s own words.
This is not a persona sketched from a demographic quota. It is an expensive, individual, interview-grounded construction. Keep that in mind when the number is quoted in support of something much cheaper.
What the 85% actually measures
The researchers compared each agent’s answers with the answers of the person it was built from. Then they did the thing that makes the study interesting: they compared that result against how well those same people reproduced their own answers two weeks later.
The agents reproduced the answers of their source individuals at roughly 85% of the reliability those same humans showed with themselves after a two-week interval.
So 85% is a share of a ceiling. It is a relative benchmark. It measures how close the agents came to the level of consistency that real people achieve with themselves.
It is not 85% agreement with humans. It is not 85% accuracy. It is not a promise that eight answers in ten will be right in any absolute sense.
85% of a ceiling is not 85% of the truth.
Why the relative benchmark is the better one
Here is the part that gets lost in the correction: the relative framing is not a weaker claim dressed up. It is a more honest one, and methodologically it is the right choice.
People do not give the same answer twice. Ask someone how likely they are to buy something on a Tuesday and again a fortnight later, and the two answers will differ — not because anyone lied, but because attitudinal measurement contains real variation. Test-retest reliability is how we quantify that variation, and it has been a standard instrument in psychometrics for decades.
Which means there is a ceiling on what anyprediction can achieve, human or synthetic. A model that matched a person’s answers more closely than that person matches themselves would not be a better model. It would be a broken measurement, or an overfitted one.
Measuring against that ceiling is therefore the disciplined thing to do. The failure is not in the study. The failure is in the retelling — where “85% of the human reliability ceiling” becomes “85% accuracy,” and a careful result turns into a sales claim.
The other numbers in the same paper
On held-out items — questions not used to build the agents — the paper reports 83% for interview-only agents, 82% for survey-only agents, and 86% for agents combining both sources. Agents built from demographics alone reached 74%.
All of these are expressed against the same human reference point. They do not mean the agents were 83%, 82%, 86% or 74% accurate. The spread is still informative: the jump from 74% to the low-80s is the value of grounding an agent in something richer than a demographic profile.
The paper also reports correlations above 0.9 between the patterns of effect sizes observed in randomized experiments and those the agents produced. That is a genuinely strong result. It suggests agents can recover the direction and structure of differences between groups or conditions.
But recovering a structure is not the same as sizing an effect.
Where it still breaks
That limitation shows up clearly in related work, which is often blurred together with the 85% figure. A 2026 study in Nature by Ashokkumar, Hewitt, Ghezae and Willer examined 70 pre-registered experiments, 469 effects and 119,330 participants. Simulated treatment effects correlated with real ones at r = 0.85, and the models matched or outperformed human forecasters on that measure.
And yet they systematically overestimated the magnitude of the effects.
Aher, Arriaga and Kalai had documented the same over-amplification back in 2023: models often find the right direction and exaggerate the size. Three years on, it is still not fixed. Anyone selling you a synthetic panel should be able to tell you this without being asked.
Our own number, and the same question
We are not exempt from this. On 30 June 2026 we published a validation of our US panel against Twin-2K-500, the public dataset of 2,058 real Americans released by Columbia Business School. Our synthetic respondents — built only from public population statistics — reached a correlation of 0.83, the same level as Columbia’s individual “digital twins,” which are themselves constructed from each person’s real answers.
That result is public, dated, and anchored to a dataset anyone can download and rerun.
It also deserves exactly the question this article is about: 0.83 of what?
It is a correlation, not a share of a ceiling. It concerns aggregate responses, not the ability to reproduce a particular individual. So it does not compare directly with the 85% from the Stanford work, which reports performance against a ceiling of individual self-consistency. The two numbers describe different things about different objects, and setting them side by side as though one beat the other would be precisely the error this article is complaining about.
We spell that out because it is the rule we are asking everyone else to follow. A number that does not say what it measures is worth nothing, even when it is a good number — and especially when it is ours.
The question buyers should ask
None of this is an argument for dismissing the 85%. It is an argument for putting it back where it belongs.
A relative benchmark is useful precisely because it is bounded by something observable. Most conventional survey vendors never publish anything comparable about the stability of their own respondents or the reproducibility of their own results. The synthetic field, for all its noise, has at least started measuring itself against a stated ceiling.
But when “85% of human test-retest reliability” is compressed into “85% concordance with humans,” it stops being a measurement and becomes a promise the paper never made. And the buyer who acts on that promise will, sooner or later, size an effect wrongly and blame the method rather than the citation.
So the question to put to any vendor — including us — is short: 85% of what?
The answer tells you whether you are being shown a measure of relative consistency or sold a claim of accuracy. It should travel with the number every single time it is quoted. If it does not, that tells you something too.
For the longer view — what synthetic panels are, how respondents are actually built, and where the method is and is not decision-grade — see our reference guide to synthetic panels.
Two companion notes put the same discipline to work on specific claims: what calibration means, and what a buyer can check, and under-dispersion, with a test anyone can run.
The vocabulary. Each term on its own page, with what a buyer can check: digital twin · synthetic respondent · calibration · the full glossary
Method over Magic.