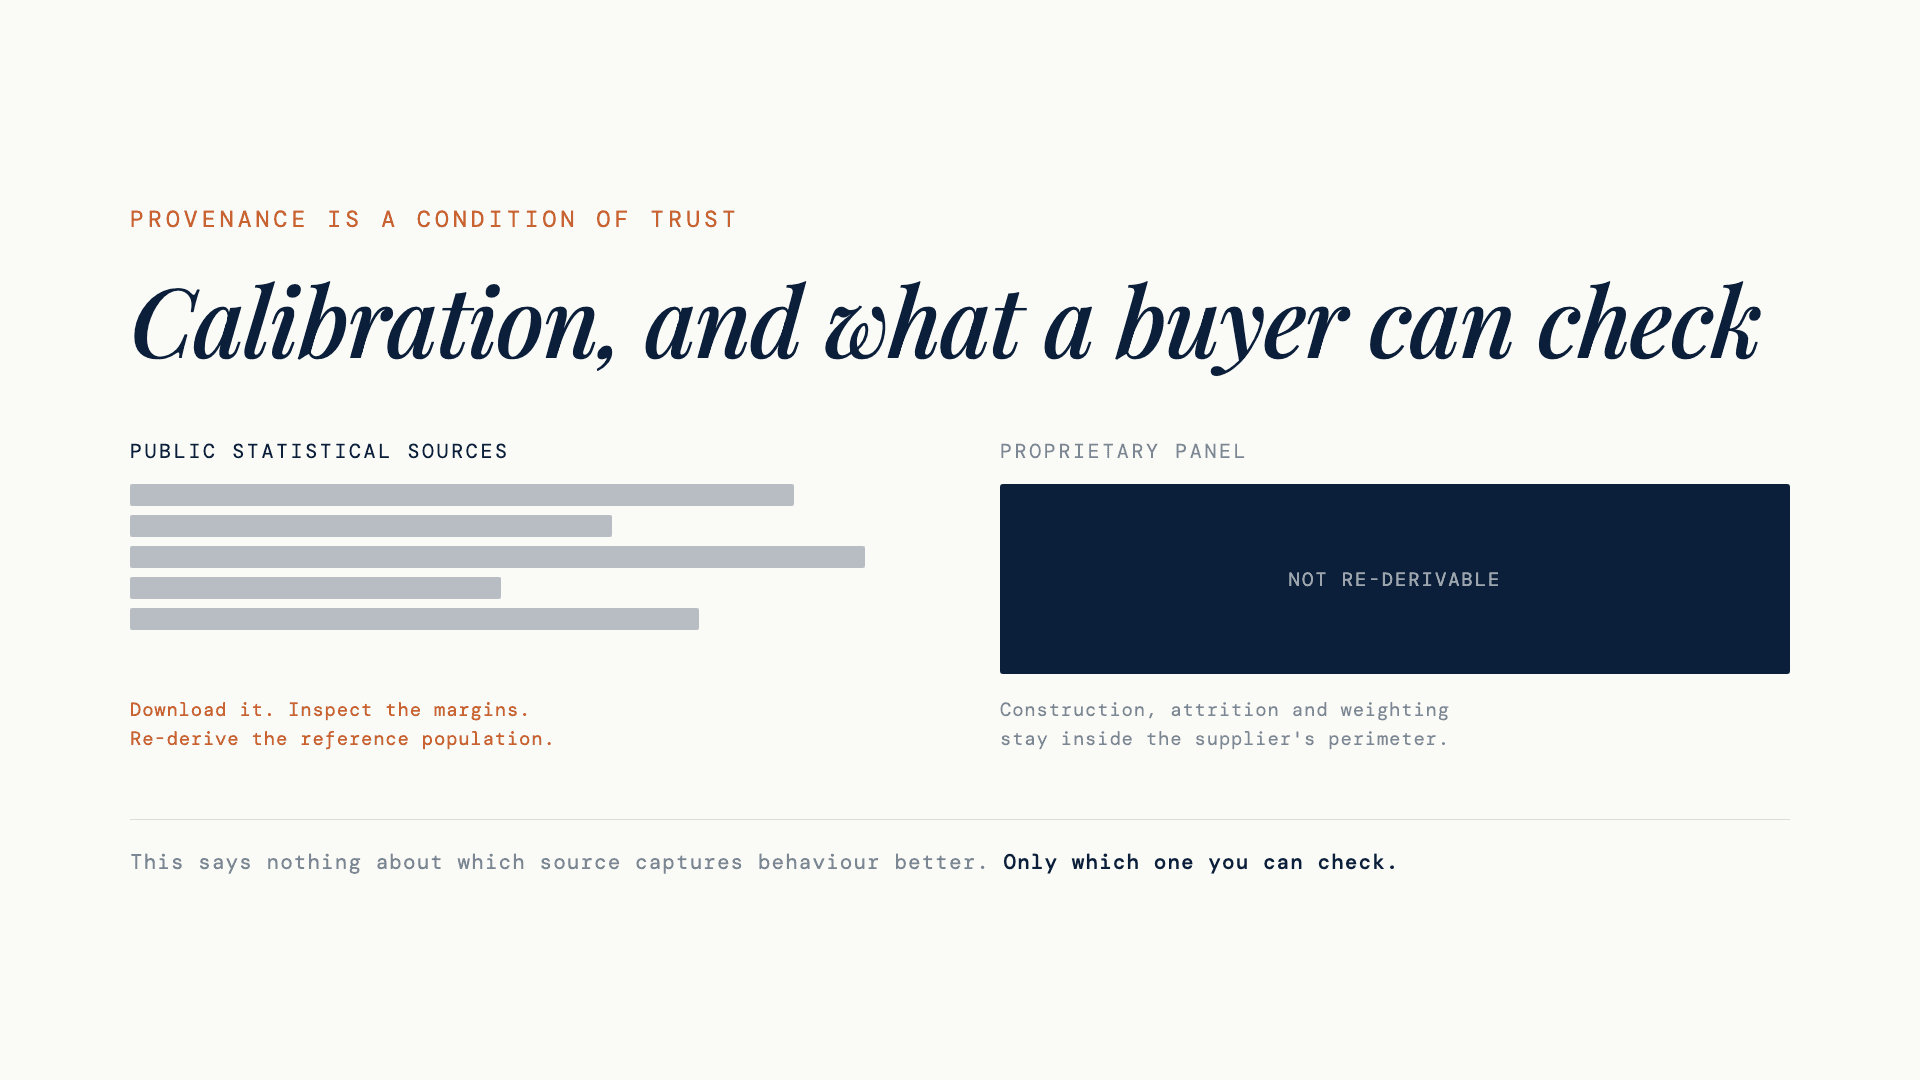
Calibration, and what a buyer can check
A commentary priced the calibration layer at $2 billion. ESOMAR's own figures say 8% of research leaders consider synthetic data reliable enough for a business decision. This note argues that calibration does not require a private panel — and reports what we found when we audited our own claims against ESOMAR's 20 Questions, including three we were making publicly that were not true.
En français — La calibration expliquée : calibré n’est pas validé
Position note for the ESOMAR community, ahead of the Congress, 2–3 September 2026.
Declaration of interest. I am the founder of FlashInsight, the system described in this note. The measurements reported here were produced by that system, on protocols we designed. Read them accordingly: they are offered as evidence to be examined, not as independent findings.
Where this note comes from
On 31 July 2026, Insight Innovation Ventures published a commentary arguing that a company had just priced the calibration layer at $2 billion — not synthetic generation itself, but the machinery around it: comparing simulated distributions with real human distributions, scoring confidence for each output, recalibrating when the evidence demands it.
The piece did the profession a service, and I want to say so plainly: it named the right object. Most commentary on synthetic research argues about whether generation works. This one moved the question to what sits around the generation, which is where the difficulty actually lives. Its central proposition — that generation is becoming commonplace while calibration is not — is a reading of market structure rather than a measured finding, and I take it as a framing rather than as evidence. The practical advice was the part I acted on: if you enter this layer, enter through validation, not generation.
I did not set out to answer it. I set out to see whether we could pass the test it implies.
That turned into a month of work, and it did not go the way I expected. Reading our own claims against ESOMAR’s 20 Questions to Help Buyers of AI-Based Services, we found three statements we were making publicly that were not true.
We said AI-generated content was always flagged as such. It was flagged by the model, on request, not by the system — so it was there in practice and guaranteed by nothing. We said uploaded material could not hijack a simulated respondent. We tested it properly for the first time and eight injection attempts out of eight succeeded. And our contract promised a deletion routine that no process actually executed.
None of these were caught by our tests, our reviews, or our own reading. They were caught by the discipline of writing a document that could only assert what it could prove — a discipline we adopted because of that commentary. Whatever one makes of its market thesis, it produced a month of useful work in at least one company.
We corrected what could be corrected and documented what could not. The claims below describe the system as it stood at the end of that audit.
The gap between $2 billion and 8 percent
The debate contains a striking gap between capital and the field.
Capital may value the calibration opportunity at $2 billion. The ESOMAR CEO Playbook 2026, based on 224 executives, reports that only 8 percent consider synthetic data reliable enough for a business decision. Thirty-six percent believe it never will be. Sixty-six percent do not use it at all.
One caveat, and it applies to this note’s own standard. The Playbook is circulated to ESOMAR members and is not publicly downloadable. A reader outside the membership cannot currently audit these figures, the question wording or the denominators. I report them as member-circulated findings, not as fully auditable facts.
These figures measure a declared judgement about reliability for business decisions. They should not be read as a direct measure of trust without the survey wording and response context, which are not public.
The pattern of intended use is equally revealing. Testing and simulation lead at 21 percent, followed by digital twins and personas at 17 percent, and boosting at 15 percent. Synthetic panels stand at 5 percent — the last-ranked use.
On this evidence, current use appears exploratory rather than substitutive. What is gaining ground is repeatable screening: using synthetic methods to explore, compare or prioritise possibilities before committing to more expensive or consequential research.
That is a narrower proposition.
The question is not whether synthetic respondents can replace people in every decision. It is whether their outputs can be bounded, challenged and interpreted with enough discipline to support a defined use. That is what calibration must answer.
What calibration really means
Calibration is not a decorative confidence label placed on top of generated data. It is a chain of empirical controls.
First, the distribution of simulated answers must be compared with the distribution observed among real people. Second, confidence must be assessed at the level of the output, not declared for the system as a whole. Third, the system must be recalibrated when the evidence shows systematic divergence.
This does not make a synthetic output true. It makes the relationship between the output and an external reference explicit.
That distinction matters. A model can be internally coherent and still be poorly aligned with the population it claims to represent. It can also resemble an observed distribution while being unstable or theoretically incoherent.
Calibration is therefore not a single property. It involves at least two separate questions: does the sample align with real-world distributions, and is the sample coherent in itself?
These questions must not be collapsed.
Why public provenance matters
Our position is that calibration does not require a private panel as its sole anchor. It can begin with public statistical sources published by institutions such as INSEE, ISTAT, INE, Destatis, the Office for National Statistics, the US Census Bureau, INEGI, the Haut-Commissariat au Plan, Eurostat and the European Social Survey.
The value of these sources is not that they are automatically perfect. The value is that their provenance is open.
A buyer can download the source data. A researcher can inspect the categories, distributions and margins. A third party can check whether the calibration inputs correspond to what the public institution actually reports. The buyer does not have to take the supplier’s word for the existence or composition of the reference population.
On one dimension — independent inspection — public provenance offers something a proprietary panel cannot. That is a narrow claim, and it should stay narrow. It says nothing about which source captures human behaviour better.
A private panel may hold rich information that public statistics do not. It may support more granular validation. But its construction, attrition, weighting and historical composition remain, to a degree, inside the supplier’s perimeter. The buyer cannot reconstruct it from first principles.
That is not a complete answer to validity. It is an answer to provenance — and provenance is a condition of trust.
Reliability and validity are not one number
The most important principle here is methodological. We keep alignment outside the coherence score. We do not add them together.
In measurement theory the two are distinct. Reliability concerns the consistency of scores under specified conditions. Validity, in contemporary usage, is not a property the instrument owns: it is the body of evidence supporting a particular interpretation and use of the scores, for a stated construct and population. A result can be highly reliable and still not support the interpretation placed on it.
A provider that fuses both into a single number called “confidence” is selling a number with no clear meaning.
Our reliability index runs on every production sample: a score from 0 to 100 with a traffic-light reading, components and thresholds versioned.
But one component is not a score. It is a gate, and strictly speaking it does not test reliability at all: it tests sensitivity to the variables that define the sample. If those axes do not move the responses, the index is forced to red and no coherence score is displayed. A sample that ignores the variables supposed to define it should not be able to compensate through strength on unrelated dimensions.
When the gate fails, no coherence score is reported at all.
What our evidence shows
Our evidence base comprises three kinds of result, measured on our protocols and not copied from published papers. The distinction argued above applies to them too, so each is labelled for what it actually is.
Reliability evidence. Test–retest performance reaches 26 percent of the ceiling set by the same people reproducing their own answers — a ratio to an observed human ceiling, not a percentage of correctness.
Evidence of distributional alignment. Two benchmarks, in different countries, languages and instruments.
Against Twin-2K-500 — the public dataset of 2,058 real US adults released by Columbia Business School — 150 personas drawn from public Census/ACS margins alone, with no seeding on any individual, reproduce the rank ordering of real human ratings on eight product perception items at Spearman ρ = 0.83, mean absolute error 0.52 on a 1–7 scale. Columbia’s own digital twins, each conditioned on one real person’s full answer history, score 0.81(Gemini-class) and 1.00 (GPT-class) on the same items. Across the full 27-item battery, ρ = 0.79.
That result replicates. An independent 100-persona sample, rebalanced to the same margins, returns ρ = 0.833 — the first-wave figure to three decimals, on a different draw of a different size.
Against the European Social Survey in France — ESS Round 11, roughly 1,771 real adults, 18 attitude items — 150 personas reproduce the real French attitude profile at ρ = 0.97 between synthetic and real item means, with a mean absolute error of 0.35 on 0–10 scales, on public data alone.
Distributional alignment is evidence bearing on validity, not validity itself: two distributions can agree while resting on wrong mechanisms, wrong correlations or wrong subgroups.
Nomological consistency. Of 18 directional relations predicted by established theory — the sign of the association between a value or trait and an expressed attitude — 18 held in the simulated population, on two models and in two prompt framings. This is agreement with theory-predicted relations. It is not internal consistency in the psychometric sense, and it uses no external reference.
I would not call these three independent. They were produced by one team on one system, and no analysis establishes independence between their samples, protocols or assumptions.
And here is the limit that matters most commercially, stated in our own validation paper. Neither benchmark contains brand, concept or advertising tests. They contain attitudes, perceptions and consumer scales. So this work establishes general response fidelity across two real populations — it does not establish concept-test or ad-test predictive accuracy, which is what most buyers of synthetic research actually want to know.
We are not standing still on it. Separately from the two benchmarks above, on a six-concept test measured against a reference field panel, our calibrated scores reached a rank correlation of ρ = 0.94, against a validation threshold we had set in advance at 0.80. That is a different protocol, a different comparison set and a different unit from the ESS and Twin figures — it is not a third point on the same scale, and I will not present it as one. It is one test, on six concepts, measured by us.
We replicate that exercise on live R&D work with brands as the occasions arise, and this is the part of the programme where outside participation would help most. Any organisation willing to run a concept test in parallel — theirs on real fieldwork, ours on synthetic, both blind to each other until the end — is welcome to take part. We will share the protocol, and we will publish the result whichever way it goes. That is how this gap gets closed, and it cannot be closed by one supplier measuring itself.
One further finding belongs here rather than in a footnote, because it cuts against our own product. Our calibration layer helps on judgment items and destroys perception items: applied to the eight US perception items it drives the rank correlation from 0.83 to approximately zero, and on the French attitude battery it moves mean absolute error from 0.35 to 0.78, inverting reverse-coded items. The rule we now enforce — judgment scores calibrated, perception scores direct — was learned from that failure, not designed in advance.
These results are encouraging. They are not a licence to generalise beyond the protocols that produced them.
And the public/private distinction applies to us too. The public sources behind our calibration can be downloaded and checked. Our own reliability measurements and correlations cannot. They remain our measurements until someone else replays the protocols and obtains comparable results. That asymmetry is stated here because it bears on how the figures should be read.
What we do not know, and what we have exposed
We published the complete set of 20 ESOMAR answers, including the failures.
Before the fix, eight injection attempts out of eight succeeded. We then built an output filter against the disclosure of our own instructions, measured it, and deliberately did not ship it— the same sentence is a leak when the model recites it and a legitimate answer when a respondent quotes it, and every calibration we tried destroyed genuine verbatims. Damaging a client’s real data is worse than disclosing an instruction to that same client. We therefore did not deploy the filter, and that vulnerability remains unresolved.
We also observe compressed dispersion: simulated respondents within a group resemble one another more than real people do. A system can reproduce central tendencies while understating the range of human response — the output looks orderly while concealing disagreement, uncertainty and minority positions.
We publish no confidence intervals. The reason is not compression alone: we have not characterised the estimand, the sampling plan or the dependence between simulated observations well enough to state what an interval would cover. Until that work is done, any interval we published would describe our generator rather than a population.
We have no third-party audit. No certification. No continuous testing programme.
These limitations define the current scope of the claim.
A responsible calibration layer must show not only where it performs, but also where the evidence is still internal, incomplete or unavailable. The buyer should be able to distinguish public facts, supplier measurements, unresolved weaknesses and methodological safeguards. That separation is more valuable than a single attractive confidence score.
What we propose to the profession
A verifiable calibration record: public and inspectable reference distributions where they exist; versioned definitions and thresholds; separate reporting of alignment and coherence; explicit failure gates; disclosed limitations; and independent replay of supplier-owned measurements wherever it can be arranged.
The future of synthetic research will not be decided by whether generation can imitate a plausible answer. It will be decided by whether the buyer can understand why an answer should be trusted, where that trust stops, and whether the evidence behind it can be checked.
The vocabulary. Each term on its own page, with what a buyer can check: calibration · under-dispersion · synthetic population · the full glossary
Method over Magic.
Sources
The commentary this note answers. “Simile Just Priced the Calibration Layer at $2 Billion”, Insight Innovation Ventures, 31 July 2026.
The industry framework. ESOMAR, 20 Questions to Help Buyers of AI-Based Services · ICC/ESOMAR International Code · ESOMAR AI Alliance CEO webinar deck, August 2026, and the ESOMAR CEO Playbook 2026 with Léger (n = 224) — both circulated to members, neither publicly published.
Governance. Gallup, Gallup Begins Research on Simulated Responses, Jenny Marlar and Zacc Ritter, 11 May 2026.
Academic references.Toubia, Gui, Peng, Merlau, Li & Chen (2025), Twin-2K-500, Marketing Science · Park et al. (2024), Generative Agent Simulations of 1,000 People · Ashokkumar, Hewitt, Ghezae & Willer (2026), Nature 656, 115–122 · Wang et al. (2025), Nature Machine Intelligence, on the flattening of identity groups.
Our own published record. The 20 ESOMAR answers in full · AI usage framework and our five commitments · Privacy policy · On the 85% figure the market quotes incorrectly · Under-dispersion, and a test anyone can run · Reference guide to synthetic panels