Under-dispersion, and a test anyone can run
In our answers to ESOMAR's 20 Questions we committed to publishing what we found on domain fine-tuned models, either way. Here is the result — and, more usefully, the method that produced it. It runs on published data, costs nothing, and scores our own work unflatteringly in places.
In our answers to ESOMAR’s 20 Questions we wrote that we were testing domain fine-tuned models, and that we would publish the result either way. This note is that result. The verdict matters less than the method, so the method comes first — and it is one any buyer can run.
The defect, in plain terms
Take ten real people of the same age, the same gender and the same political leaning. Ask them how much they trust parliament. They will not agree. They will spread out across the scale, because people who share a profile are still different people.
Simulated respondents do not spread out enough. Inside a group they converge. This is the best-documented weakness of synthetic samples, it is not specific to any one supplier, and we have stated it in our own compliance answers: dispersion is compressed, and until our reliability index scores it, any confidence interval derived from our variance would be too narrow, so we publish none.
Why almost nobody checks it
The obstacle is not the arithmetic. It is that a dispersion number has no meaning on its own. If a supplier tells you their simulated respondents reach 0.68 of the spread of real ones, you cannot tell whether that is good. Real people re-interviewed do not reproduce themselves perfectly either. Without knowing what a human scores on the same measure, 0.68 is a number without a scale.
The trick is not the metric. It is the control: the same humans, re-interviewed.
That control exists in public data. The Columbia Business School Twin-2K-500 dataset contains the same individuals answering the same battery in more than one wave, alongside thirteen published specifications of simulated twins. So you can compute, on identical people and identical items, what a human scores and what each model scores. The human answer is the yardstick, and it is the part that is usually missing.
The method
For each item, take the standard deviation of the simulated answers and divide it by the standard deviation of the real answers. Do it inside segments as well as overall, because compression within a group is the thing at issue. Average across items — the figures below are means, not medians, and the two do not always agree. Then do exactly the same for the human control.
Two cautions, both of which changed our own numbers when we applied them. Responses outside the declared scale are not responses — of the thirteen published arms, one emits values up to 9 on a 1–5 scale and another up to 6, and leaving them in inflates those arms’ spread. And the between-group estimate is biased upward when groups are small, so it needs correcting before any ratio is taken.
What it gives
On 1,551 individuals and 28 items, all arms measured on the same people:
- The same humans, re-interviewed: 1.02. That is the ceiling, and the reason every other number below can be read.
- The eleven simulated arms: 0.47 to 0.79.Every one of them is short. None comes close to the human control. (Thirteen specifications were published; two are excluded here — one whose respondents overlap the fine-tuned arm’s training set, one with 31% of a block missing.)
- The spread between arms is large, and it is not explained by model size. Prompt form and model choice move dispersion more than anything else we measured.
The fine-tuning result we promised
One of the thirteen published specifications is a fine-tuned model — GPT-4.1-mini, trained on 500 responses. It had never been measured on dispersion, only on individual accuracy. Measuring it cost us nothing: no training, no inference, only re-analysis of outputs another team had already published.
The advantage is not large enough to outweigh the four properties we set out in question 5 — portability, currency, auditability, and transferability across countries. Against a decision rule written down before we looked at the results, the fine-tuned arm fails on two of the three comparators we declared — JSON Persona and Text Persona — and passes only against the weakest, demographics alone. One caveat on that rule: it was amended twice after the first run, when two of its own invalidation conditions fired, so this is not a strictly confirmatory result.
It would be dishonest to stop there, because it wins on two of the three measures we computed. On the accuracy of attitudinal means it is first of eleven. On how variance is split between and within groups it is first as well, though by a margin that depends on how one aggregates and that we would not defend as decisive. On total dispersion — the measure this note is about — it is sixth of eleven, and five prompting configurations beat it. It does not fix the defect: on within-ideology dispersion — a different measure from the one this note leads with — it sits about a third below the human level.
So the answer to our own question is no, and the reasoning is available for anyone who wants to reach a different one. Two limits belong with it. The arm we measured is someone else’s; we did not train a model. And the dataset is entirely American, so the cost of applying a model trained on one country’s responses to another remains unmeasured.
What the same test says about us
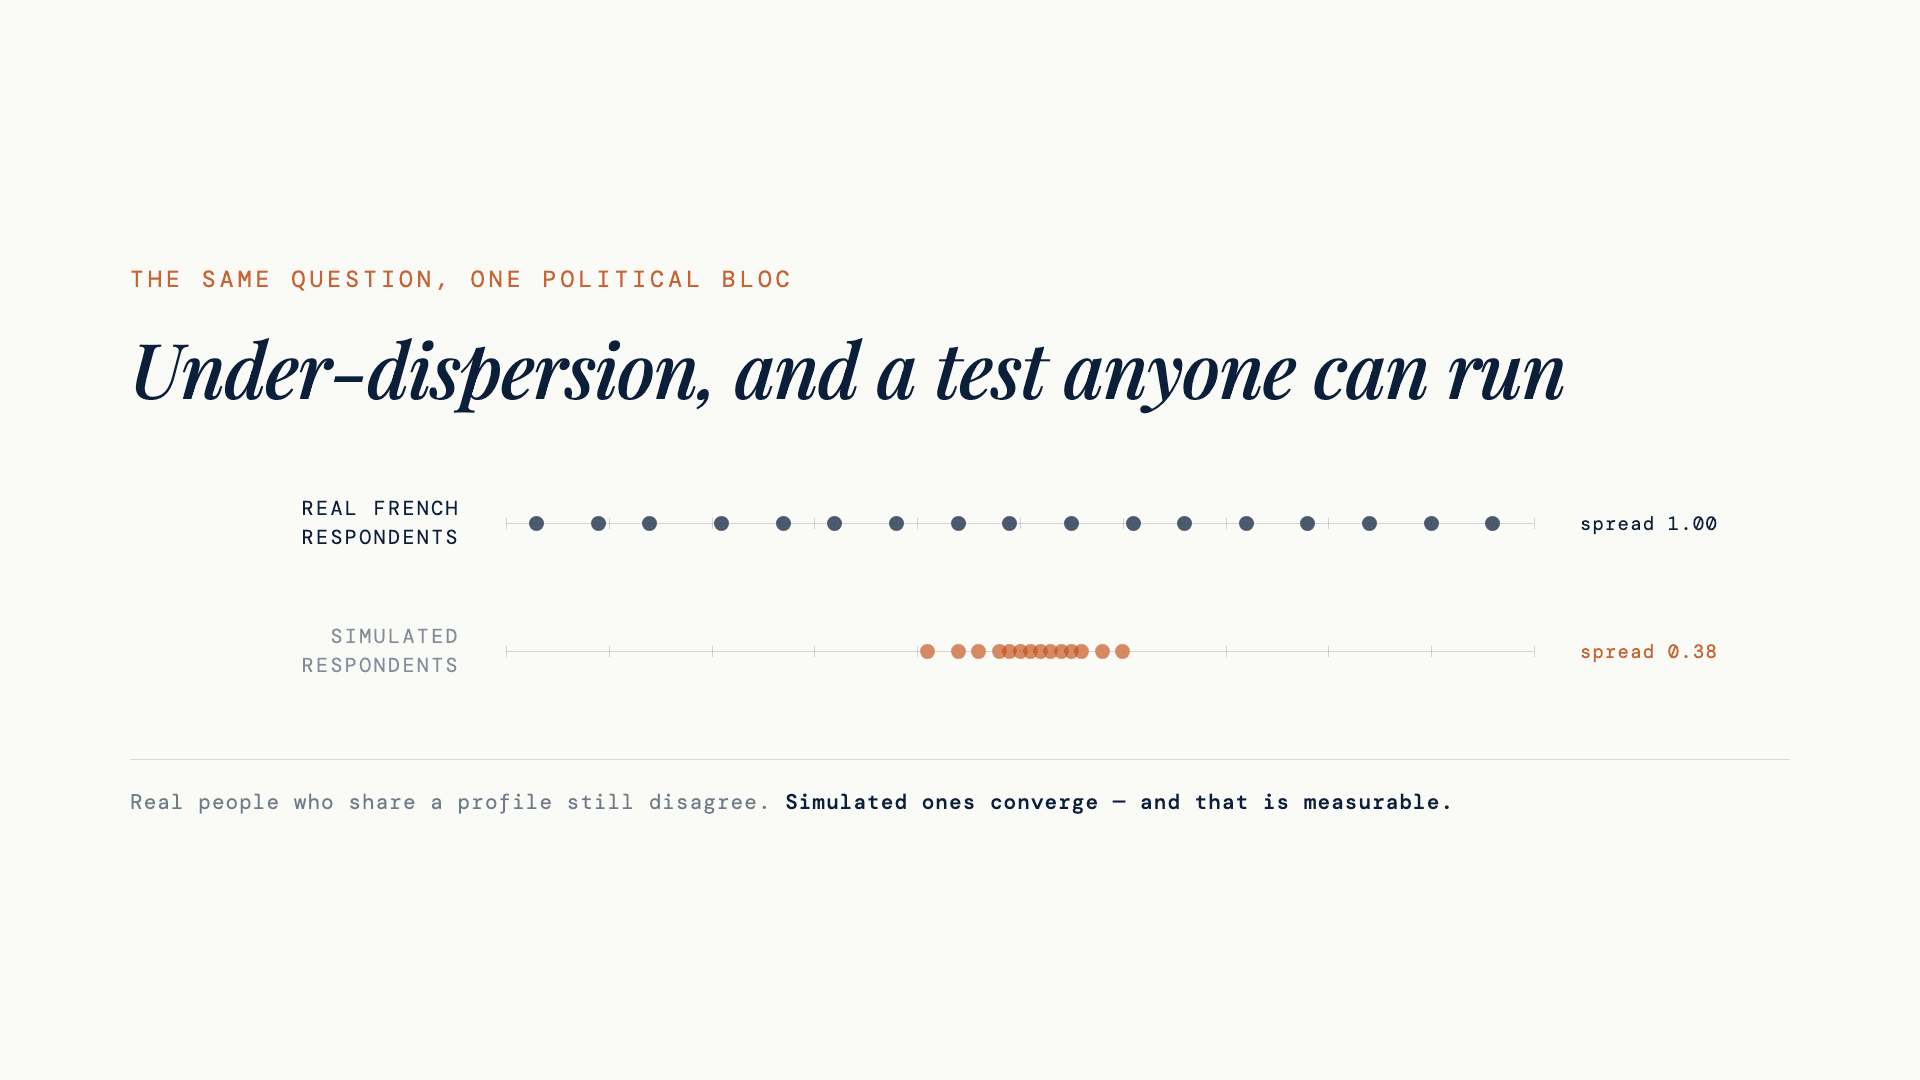
We ran it on our own French panel against 1,771 real French respondents from the European Social Survey, round 11. Inside a political bloc, our simulated respondents reach 0.38 of the spread of real French people. That holds on all 18 items and in every one of 3,000 bootstrap replications. It is the firmest number in the whole exercise, and it is not flattering. (It is also not the measure a concept test is read on. That is a different quantity, we have measured it against a real field panel, and it is in the next section — a reader who stops here will have taken the harshest number in this note for the whole of it.)
One thing we could not settle, and prefer to state rather than omit. On this same battery, how far apart our panels place demographicgroups came out differently in two configurations — one below the real gap, one above it — with bootstrap intervals too wide to separate them on 150 respondents. It is a question this battery cannot answer, not a finding about our panels in general, and it is on our list to bound properly.
What this does not cover — and what does
Twin-2K-500 contains no brand test, no concept test and no advertising test. Its closest items are generic ratings of the benefit and risk of familiar products, which is not the same task. So nothing in this note speaks to the commercial use case, and we will not stretch it to.
That case has been measured, separately and on a different protocol. On a six-concept test run with an international food brand, the ranking produced by our calibrated scores matched a reference field panel at a rank correlation of ρ = 0.94, against a validation threshold we had set in advance at 0.80. The study itself belongs to the client and its contents are not ours to publish. Two things must be said about that figure, and we say them wherever we quote it: it is one test, on six concepts, measured by us — and it measures the ranking of aggregate scores, which is what a concept test is read on, not the dispersion this note is about. The two are different quantities, and a good result on one does not settle the other.
Run it yourself
The figures above use data that is already public: Twin-2K-500 is released under CC BY 4.0, and the European Social Survey is free to registered researchers under a non-commercial licence. The method is four lines of arithmetic, and that part needs neither our cooperation, our software, nor our permission — which is the point.
One number here is not independently reproducible, and we would rather flag it than let a reader discover it: the French 0.38 compares 1,771 real ESS respondents — public — against 150 synthetic respondents drawn from our own system, which are not. The human side can be checked; our side has to be taken on the description we give of it. That is a real limit on this particular figure, and it is the kind of thing this whole exercise exists to make visible.
One clarification belongs with those 150, because the number invites the wrong objection. They are a generation budget, not a sample of 150 French people: we could have produced ten times as many, and no survey design constrains the figure. What that means in practice is that the uncertainty on our side is simulation variability rather than sampling error, and it is not what is at issue here — resampling puts the ratio between 0.34 and 0.42, nowhere near the 1.00 that would clear us. Generating more would tighten that range and change nothing else, because what the resampling cannot see is whether the generator is biased. That is the question, and it is why the human control matters more than the interval around it.
We would rather the profession converged on a measure it can check than on assurances it cannot. If you run it and get something different from us, we want to know, and we will publish the disagreement.
The companion note Calibration, and what a buyer can check sets out why we think provenance a buyer can inspect matters more than performance a buyer must take on trust. This note is the same argument applied to ourselves.
Since publication. This note reported the defect and offered no remedy. On 12 September we put one into production in a single market, measured against 1,016 real respondents, and published the method and its limits: Under-dispersion, and what we did about it.
The vocabulary. Each term on its own page, with what a buyer can check: under-dispersion · synthetic survey · calibration · the full glossary
Method over Magic.
Sources
The dataset and its published specifications. “Twin-2K-500: A dataset for building digital twins of over 2,000 people based on their answers to over 500 questions”, Toubia, Berger et al., 2025. Released under CC BY 4.0.
The French reference. European Social Survey, Round 11, France, n = 1,771.
Our compliance answers, including the commitment this note discharges. ESOMAR’s 20 Questions, answered, question 5.
The wider method, and the figure behind the claims. Our reference guide to synthetic panels · 85% of what? The number the market keeps getting wrong