Under-dispersion, and what we did about it
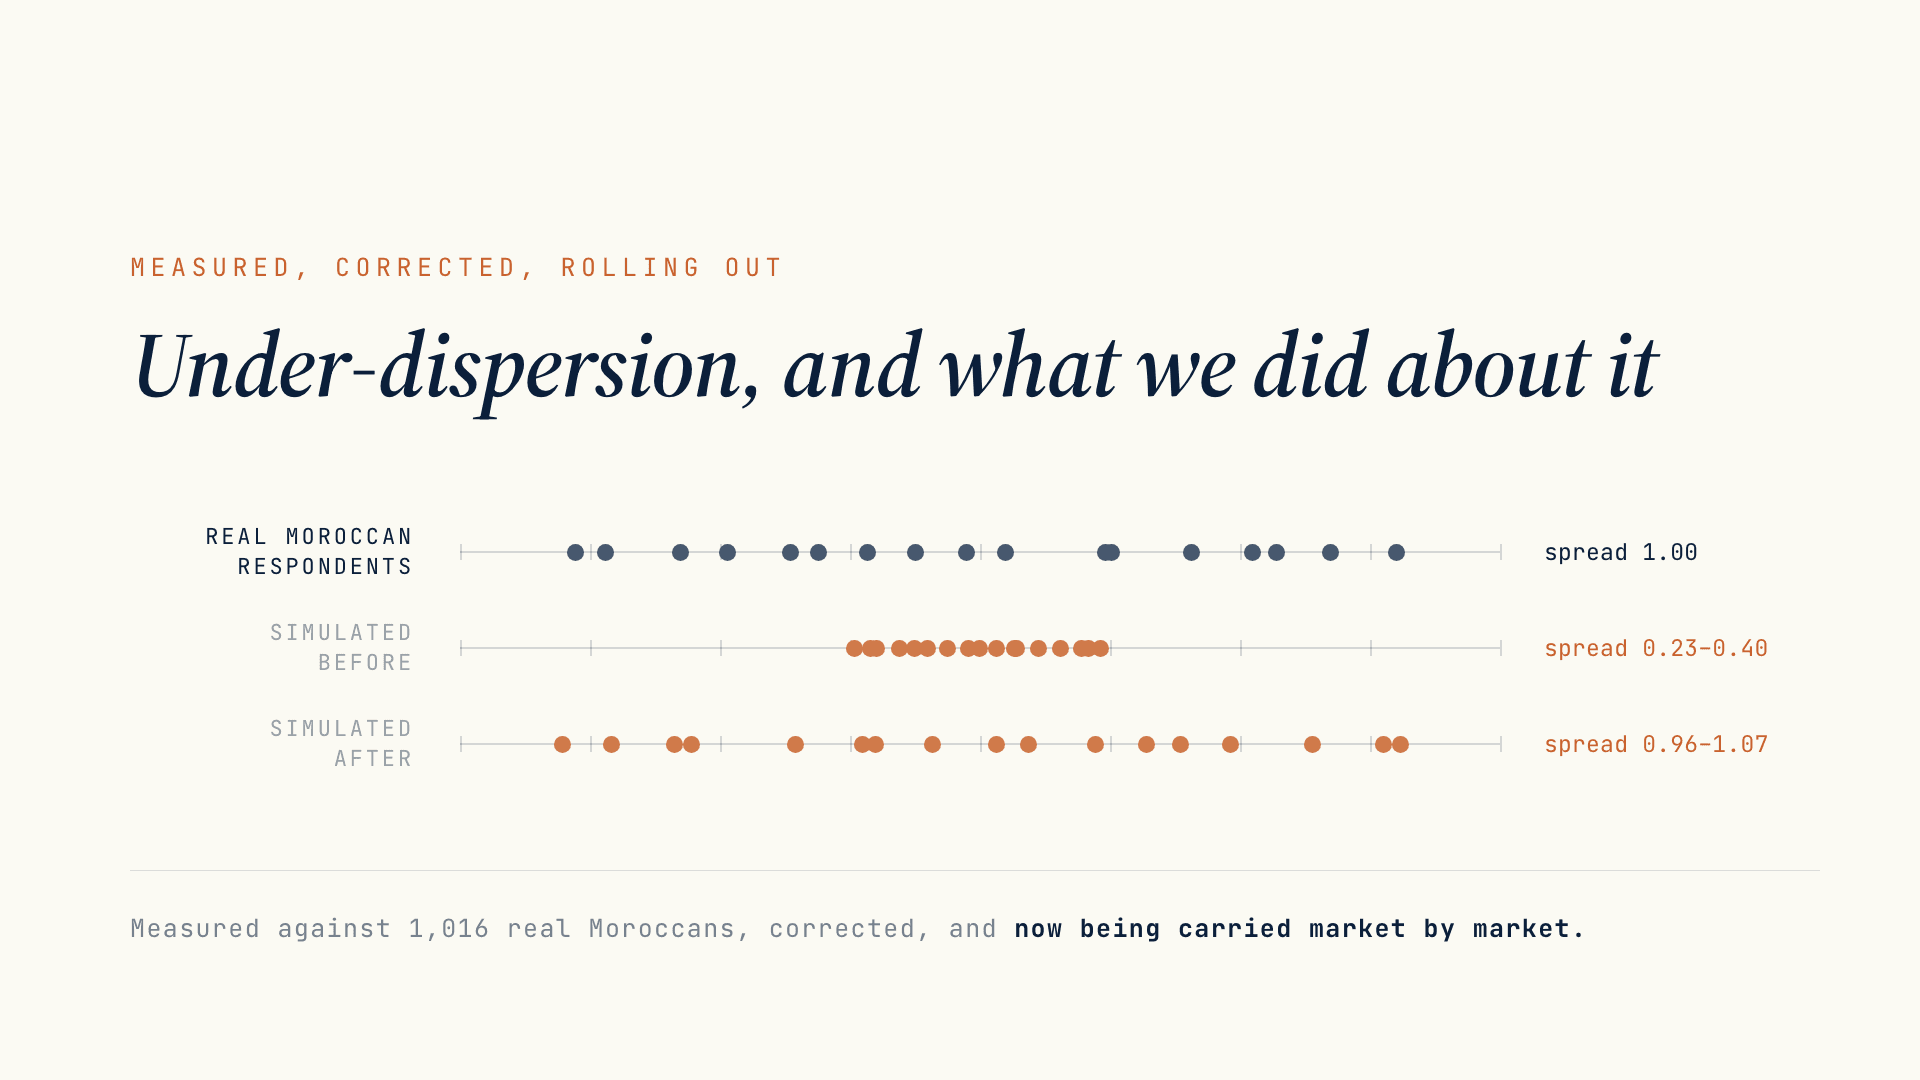
On 1 September we published a defect in our own panels: simulated respondents who share a profile agree far more than real people do. We have measured it against 1,016 real respondents, corrected it, and started rolling that correction across every market we serve.
On 1 September we published a defect in our own panels. We have since measured it against a thousand real people, corrected it, and started applying that correction market by market. Here is what it was, and what it changes when you read a synthetic study.
The defect, in plain terms
People who share a profile still disagree. Take ten Moroccans of the same age, the same education and the same size of city, and ask what matters to them in life: they will not answer alike, because people who look alike on paper are still different people.
Simulated respondents do not disagree enough. Inside a group they converge. We said so publicly at the end of August, in our answers to ESOMAR’s 20 Questions and in a test anyone can run, where we reported that inside a French political bloc our simulated respondents reached 0.38 of the spread of real French respondents. We had no remedy to offer at the time.
Why we were looking
Because this is the literature we work from. On 2 September, Science Advances published “Digital twins are funhouse mirrors”, from Columbia Business School — 19 pre-registered studies, 164 outcomes, real people compared against digital twins built from more than 500 of each person’s own answers. It is not a critique from outside the field. It is the team behind Twin-2K-500, the public dataset we use as our American reference, measuring their own technology and publishing what they found. Their first named distortion:
The SD of the twin responses is lower than that of human responses in 154 of 164 cases (93.9%), indicating underdispersion in twin responses.
One detail belongs with any quotation of that paper, including ours: they also report that on 105 of the 164 outcomes the twins’ average answers differ significantly from the human ones. Averages are the ground a concept test is read on. Anyone citing this work to say “dispersion is the problem” is citing half of it.
What we found in our own engine
Our partner Insights House surveyed 1,016 real Moroccans in 2026 on the same battery our engine scores. We generated 10,000 profiles and compared. Three findings:
- Inside a group, our respondents disagreed about a third as much as real Moroccans did — and by roughly the same amount on every trait, where real people vary a great deal from one trait to the next.
- The traits no longer hung together. Priorities that go strongly together in real Moroccans barely held together in our personas.
- Forty distinct profiles instead of 119. Counting what each respondent puts first in life, real Moroccans produce 119 different combinations. Our engine produced 40, and three traits never surfaced at all.
Every average was correct. Centred noise does not move an average — so a calibration report built on averages declares the panel sound.
That is the general lesson rather than a Moroccan one. Our Moroccan calibration passed every control we had. The defect was invisible because the thing it damages — how much people differ, and how their traits go together — is not what a calibration report looks at.
What we changed
The correction replaces the way individual variation is produced, so that a persona’s traits vary as widely, and move together as tightly, as they do among real people in that market. It is calibrated on the national survey itself rather than chosen by hand, and it carries aggregates only — no individual record.
| Measured on 10,000 personas | Before | After | Real people |
|---|---|---|---|
| Disagreement inside a group | 0.23 – 0.40 | 0.96 – 1.07 | 1 |
| Distance from real people on how traits hang together | 0.291 | 0.020 | 0 |
| Distinct profiles produced | 40 | 120 | 119 |
The averages did not move, which was the requirement. We also ran the harder check — calibrating on half the survey and scoring against the half we had not used. That result is less flattering than the headline figure, and still far better than where we started.
We publish the result and not the construction, and would rather say so than be vague about it. How to measure this defect is published; how we repair it is not. The measurement belongs to the profession — it is what lets a buyer audit us, and we published it in full on 1 September, runnable on public data without our permission. The repair is engineering we paid for, including one plausible route that turned out to make the panel worse.
Now every market
Morocco was the test case. France followed today, on a different national survey and a different battery. The same correction is now being applied to the rest of our markets, in the same order of work: find the national survey that measures the population properly, match it to the traits our personas carry, calibrate, then check the result against the real respondents before it ships.
That last step is what makes this slower than a software fix and better than one. Each country is a piece of research, not a configuration change — the surveys differ, the batteries differ, and one of them turned out to be too poor a measure to use at all, so we did not use it. We would rather that took time.
Part of it has already gone everywhere at once. A second layer of the profile carried the same defect, and there a single public reference covered all nine of our populations, so all nine were corrected together. Where no such shared reference exists, it is one country at a time.
The step after that is already designed: putting questions the personas have never seen to both them and real people, which is what would take this from calibrated to validated. It is pre-registered, and we will publish the result whichever way it falls — as we did with fine-tuning.
What this changes when you read a synthetic study
This is the part worth keeping, and it applies to any synthetic study, from any supplier, that has not published a dispersion figure.
- Agreement inside a group is overstated. Ninety percent of simulated respondents saying the same thing may correspond to seventy percent of real ones. This is the most expensive misreading available, because unanimity is exactly what makes a slide persuasive.
- Differences between audiences are real in direction, and understated in size. We hold those differences back rather than invent signal, so read a gap as “at least X points,” not as “X points.”
- “No profile carries this concept” may be the panel talking. When the range of profiles is narrow, a link between who someone is and what they answer can be flattened out of sight.
- In qualitative work it matters more. A group can only disagree as much as the people in it differ. Forty profiles instead of 119 means the discussion converges too early, and “does anyone see it differently?” finds nobody — not because the disagreement is absent from the market, but because it was never recruited.
Which suggests one question to put to any supplier of synthetic respondents, us first: what is your dispersion figure, and what is it measured against? A supplier who has one will tell you. A supplier who has never looked will tell you that too.
Where this leaves us
Two weeks ago we published a defect with no remedy attached. There is now a remedy, it is live in two markets and being carried to the rest, and the reason we found it is that we read the research on our own method as carefully as we read it on anyone else’s.
The invitation from the last note stands: any organisation willing to run a concept test in parallel — theirs on real fieldwork, ours on synthetic, both blind until the end — is welcome. We will share the protocol and publish the outcome either way.
Method over Magic.
Sources
The paper. Peng, T., Gui, G., Brucks, M., Merlau, D. J., Johnson, E. J., Morwitz, V., Netzer, O., Toubia, O., et al. (2026). Digital twins are funhouse mirrors: Five systematic distortions, Science Advances 12(36), eaeh8260, 2 September 2026. Preprint: arXiv 2509.19088.
The references we calibrate and test against. Twin-2K-500, Toubia, Gui, Peng, Merlau, Li & Chen, Marketing Science, 2025, CC BY 4.0 · European Social Survey, Round 11 · Insights House national survey, Morocco, 2026, n = 1,016, weighted to Haut-Commissariat au Plan margins. The margins are public; the survey itself is our partner’s. Partnership announced 8 June 2026.
Our own published record. Under-dispersion, and a test anyone can run · Calibration, and what a buyer can check · 85% of what? The number the market keeps getting wrong · Why ESOMAR asks twenty questions · ESOMAR’s 20 Questions, answered