How Reliable Are Synthetic Respondents? Our Own Numbers, Eight Markets
Vendors quote 85 to 95 percent accuracy. We publish a different number: how much simulated respondents disagree with each other, measured against national surveys in eight markets — and the four things it still does not prove.
Synthetic respondents are reliable enough to rank and screen ideas, and not yet reliable enough to replace fieldwork. The 85 to 95 percent figures vendors quote compare averages, which is the easy part. Measured against national surveys in eight markets, our simulated respondents disagreed with each other at 0.20 to 0.76 of human levels before correction, and at 0.85 to 1.07 after.
Key takeaways
- Accuracy and reliability are different measurements. An accuracy figure compares averages. A dispersion figure compares disagreement. A panel can be perfect on the first and broken on the second.
- Under-dispersion is the defect almost nobody reports. Before correction, our simulated respondents showed 0.20 to 0.76 of human spread across eight markets; after correction, 0.96 to 1.07 on the attitudinal layer and 0.85 to 1.00 on the personality layer.
- Under-dispersion leaves every average correct. It corrupts the comparison between options, not the level of any one of them, which is why it is so easy to miss.
- The figures are measured against named public surveys: the European Social Survey, the World Values Survey, a national survey in Morocco and the Twin-2K-500 dataset.
- Calibration is not validation. The out-of-sample test is pre-registered and has not been run. Four limits are stated below.
What is a synthetic respondent, and what does “reliable” mean?
A synthetic respondent is the output: the set of answers a language model produces when it is given a persona, a briefing that describes who is answering, anchored on real population data. It is not a simulation of one person. It is a statistical construct, and the useful question is never whether one synthetic respondent sounds plausible but whether a thousand of them reproduce the shape of a real population.
“Reliable” carries three meanings in this field, and suppliers rarely say which one they are reporting. Accuracy is how close a simulated average lands to a human average on a question whose answer is already known. Dispersion is how much simulated respondents who share a profile disagree with one another, as a ratio to how much real respondents of that profile disagree. Validity is whether the instrument predicts something it was not tuned against: an unseen survey wave, a market outcome. An 85 to 95 percent figure is almost always the first of the three. This note is about the second, and it is honest about the third.
Why is accuracy the wrong first question?
Because it is computed on questions with known answers, and it says nothing about spread. A headline accuracy figure tells you how close a simulated average landed to a human average on questions someone already knew the answer to. We have written about what those percentages leave out. The number that survives scrutiny is a different one: inside a group of people who look alike on paper, how much do the simulated respondents still disagree with one another?
That question has a measurable answer, it is unflattering when you first look, and almost nobody publishes it. On 14 September we published ours for one market and said we had started carrying the correction across every market we serve. That is now done, in all eight.
We are not the only ones to have noticed. NORC at the University of Chicago put it plainly two years ago: “LLM-generated responses tend to be more uniform, limiting our ability to draw deep insights from the authentic, personal ways respondents express their thoughts.” They were describing open-ended answers — the words. We measured the same flattening in the numbers. It is one defect with two surfaces, and the numeric one is the easier of the two to put a figure on.
How reliable are synthetic respondents? Eight markets, before and after
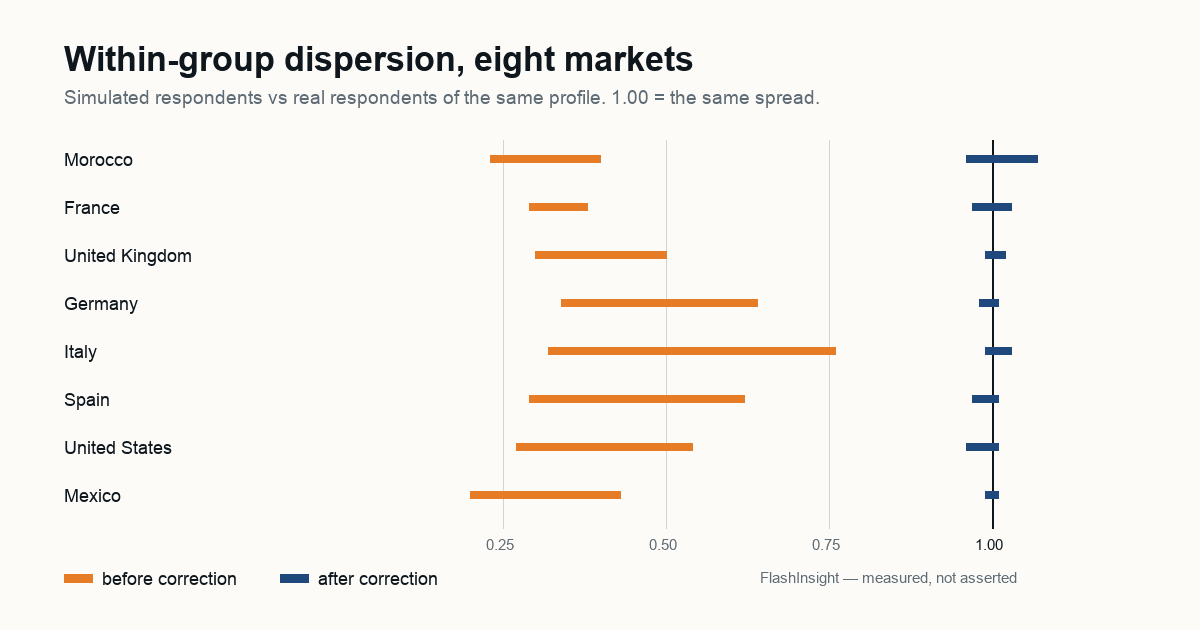
Before correction, between a fifth and three quarters of human spread; after correction, within a few hundredths of it, in every market. Read the figure as a ratio. At 1.00, simulated respondents who share a profile disagree with one another exactly as much as real respondents of that same profile do. Below 1.00 they are too alike — the disagreement that exists in the market was never recruited into the panel.
| Market | Before | After |
|---|---|---|
| Morocco | 0.23 – 0.40 | 0.96 – 1.07 |
| France | 0.29 – 0.38 | 0.97 – 1.03 |
| United Kingdom | 0.30 – 0.50 | 0.99 – 1.02 |
| Germany | 0.34 – 0.64 | 0.98 – 1.01 |
| Italy | 0.32 – 0.76 | 0.99 – 1.03 |
| Spain | 0.29 – 0.62 | 0.97 – 1.01 |
| United States | 0.27 – 0.54 | 0.96 – 1.01 |
| Mexico | 0.20 – 0.43 | 0.99 – 1.01 |
Mexico was the worst of the eight before we looked, at a fifth of human spread. It is now among the closest. The personality layer was corrected everywhere in a single pass, and moved from 0.52 – 0.99 to 0.85 – 1.00.
One calibration profile was deliberately left alone: an earlier Moroccan one, retired from new studies but kept so that work already delivered on it still reproduces exactly. Giving it back its dispersion would quietly change results a client already has. A frozen profile is not an oversight, and we would rather say so than let a count look rounder than it is.
Every average was already correct. That is exactly why nobody noticed.
This is worth dwelling on. None of these corrections changed a single average. An under-dispersed panel returns the right mean and the wrong spread, which is why the defect survives any amount of eyeballing: the summary table looks fine. What it does is make two options that the field separates cleanly come back artificially close, and two genuinely equivalent options come back artificially apart. It corrupts the comparison, not the level.
What are the figures measured against?
Against national surveys of real people, named below, never against a model of them. The five European markets are measured against round 11 of the European Social Survey. The United States and Mexico against the World Values Survey. Morocco against a national survey of 1,016 respondents run by our partner Insights House and weighted to public margins. The personality layer against Twin-2K-500, 2,058 American respondents, the public dataset we also use as a control.
Each correction was checked on five replications of ten thousand generated profiles before it shipped. We are not publishing how the correction works — that is our engine. We are publishing what it is measured against and what it measures, which is what a buyer needs to hold us to.
What does this still not prove?
Four things, and they apply to every comparable set of numbers published by anyone.
It is a calibration, not a validation. We have made the engine agree with surveys it was calibrated against. The out-of-sample bench — new questions, no second chance — is pre-registered and has not been run. Until it is, the honest phrasing is that the correction holds against this measurement, not that the problem is solved.
The reference carries its own error. On the American market we measured it: our human benchmark is itself an estimate with a margin of roughly ±0.02. So when we report that the engine reproduces human structure to 0.004, we are reporting that it reproduces our estimate to 0.004. The correction remains large — we came from 0.168 — but 0.004 is not a precision claim.
One market has no independent control. The United States could be checked against a second, unrelated dataset. Mexico rests on a single survey, with nothing to corroborate it. We say so in the module itself, and we say it here.
Our reliability index still does not score dispersion. We wrote in our answers to Esomar’s 20 Questions that dispersion was not scored by that index and that we therefore published no confidence intervals derived from our variance. The generation is corrected; that sentence about the index is still true, and we still publish none.
What should you ask any supplier of synthetic respondents?
Ask for the dispersion figure and for what it is measured against. Esomar’s 20 Questions exist because a buyer cannot tell, from a demo, a supplier who measures from one who asserts. Applied to synthetic respondents, the short list is this:
- Which population is each market calibrated against, by name and by wave?
- What is the dispersion ratio, per market, before and after any correction?
- Were the questions used to test the system seen during its calibration? If so, the figure describes fit, not prediction.
- Which markets have a second, independent control, and which rest on a single survey?
- What does your reliability index score, and what does it not score?
- Will you run a blind parallel test and publish the outcome either way?
Two and a half weeks ago we published a defect with no remedy attached. There is now a remedy, it is live in all eight markets, and it is measured against national surveys in each of them. That is a narrower claim than “we fixed it”, and it is the one we can defend.
The last note ended on one question, put to any supplier of synthetic respondents, ourselves first: what is your dispersion figure, and what is it measured against? It would have been poor form to ask it and not answer it. The table above is our answer. A supplier who has one will show you. A supplier who has never looked will tell you that too.
The standing invitation from the last two notes has not changed. Any organisation willing to run a concept test in parallel — theirs on real fieldwork, ours on synthetic, both blind until the end — is welcome. We will share the protocol and publish the outcome either way.
The vocabulary. Each term on its own page, with what a buyer can check: under-dispersion · calibration · synthetic respondent · the full glossary
Frequently asked questions
What are synthetic respondents in market research?
A synthetic respondent is the set of answers a language model produces when it is given a persona: a briefing that describes who is answering, built from real population data. It is not a simulation of one person. It is a statistical construct, and it is only as useful as the match between the distribution of answers it produces and the distribution real people would give.
Are synthetic respondents accurate?
On averages, often yes. On spread, frequently not. Accuracy figures compare a simulated average with a human average on questions whose answer is already known, which is the easiest thing to get right. The figure that matters for ranking options is dispersion: how much simulated respondents who share a profile still disagree with each other, compared with real people of the same profile.
What is under-dispersion in synthetic data?
Under-dispersion is when simulated respondents agree with each other more than real people do. Read as a ratio, 1.00 means human-equivalent spread. Below 1.00, the disagreement that exists in the market was never recruited into the panel. It leaves every average correct and corrupts the comparison between options, which is why it survives visual inspection.
Can synthetic respondents replace a real panel?
No. They are a pre-test layer between intuition and fieldwork: good for ranking and screening concepts, messages and stimuli early, so that fewer and better ideas reach the field. They are not a substitute where the finding is a minority view, a genuinely new category, or a decision that will not be checked against real people afterwards.
How do I check whether a vendor's reliability claim is meaningful?
Ask three things. What population is the figure measured against, by name and by wave. Whether the questions used to test the system were seen during its calibration; if so, the number describes fit, not predictive ability. And what the dispersion figure is, market by market, before and after any correction. A supplier who has one will show you.
What are these figures measured against?
Round 11 of the European Social Survey for France, the United Kingdom, Germany, Italy and Spain. The World Values Survey for the United States and Mexico. A national survey of 1,016 respondents run by Insights House for Morocco. Twin-2K-500, a public dataset of 2,058 American respondents, for the personality layer. Each correction was checked on five replications of ten thousand generated profiles.
Method over Magic.
Sources
Third-party observation of the same defect. Lerner, J., The Promise & Pitfalls of AI-Augmented Survey Research, NORC at the University of Chicago, October 2024.
What we calibrate and test against. European Social Survey, Round 11 · World Values Survey · Insights House national survey, Morocco, n = 1,016, weighted to Haut-Commissariat au Plan margins · Twin-2K-500, Toubia, Gui, Peng, Merlau, Li & Chen, Marketing Science, 2025.
Our own published record. Under-dispersion, and a test anyone can run · Under-dispersion, and what we did about it · Calibration, and what a buyer can check · 85% of what? The number the market keeps getting wrong · Why ESOMAR asks twenty questions · Esomar’s 20 Questions, answered