 Dr Laurent Florès
Your digital twin is more predictable than you are
In July 2026 I measured what a digital twin built from 500 of a person’s own answers actually relies on. On political attitudes, four variables explain almost all of it, and the twin turns out easier to predict than the person is to repeat themselves.
In July I put one question to a public dataset. If a language model is handed five hundred of a person’s real answers, does it become that person? What I found is narrower than either enthusiasts or critics would like. The twin learns what kind of person you are. It learns very little about what makes you different from the people who share your profile.
The data
Twin-2K-500, released by a Columbia Business School team in 2025, is the richest public resource of its kind: 2,058 Americans who answered more than 500 questions over four survey waves, each paired with a digital twin built from those answers. The fourth wave repeats questions asked earlier, so each person’s consistency with themselves, their test-retest, is measured. That is the ceiling every prediction has to be read against.
I took 29 wave-four items that the whole sample answered: ten political attitudes, four perceived benefits and four perceived risks of technologies, ten estimates of how much the public supports a policy, and an intention to get vaccinated. I added purchase propensity across 40 products shown at randomised prices. Then I asked the same two questions of the people and of their twins. How many variables does it take to predict these answers? And what changes when the twin is given more of the person?
Real people: a few variables go a long way, then very little
Predictors went in by blocks: census (10 variables), then politics and religion (4), the Big Five (5), psychographics and values (20), cognitive measures (12), economic preferences (13). Every R² below is measured out of sample.
- Census plus politics and religion, 14 variables, already captures roughly 36 to 95% of what the full 64-variable model will reach, depending on the family of questions.
- 39 variables get within about 5% of the full model in five families out of six (84% on perceived benefits).
- The two most expensive blocks barely register. Twenty-five measures from behavioural tasks (fluid intelligence, cognitive reflection, ultimatum and trust games, risk aversion) never add more than 0.015 to R², in any family.
- On political attitudes, three variables carry most of the signal: ideology, a composite of environmental values, and party.
- Which variable matters depends on the question. Environmental values carry environmental attitudes; agency and self-monitoring carry purchasing. In a forward selection, the Big Five never enters before the eighth step.
Those 14 variables are exactly the ones the Columbia team uses to build its “demographics-only” twins. It matters later.
The twin: four variables
Same pipeline, but the target is now the twin’s answer, using the twins published with the dataset.
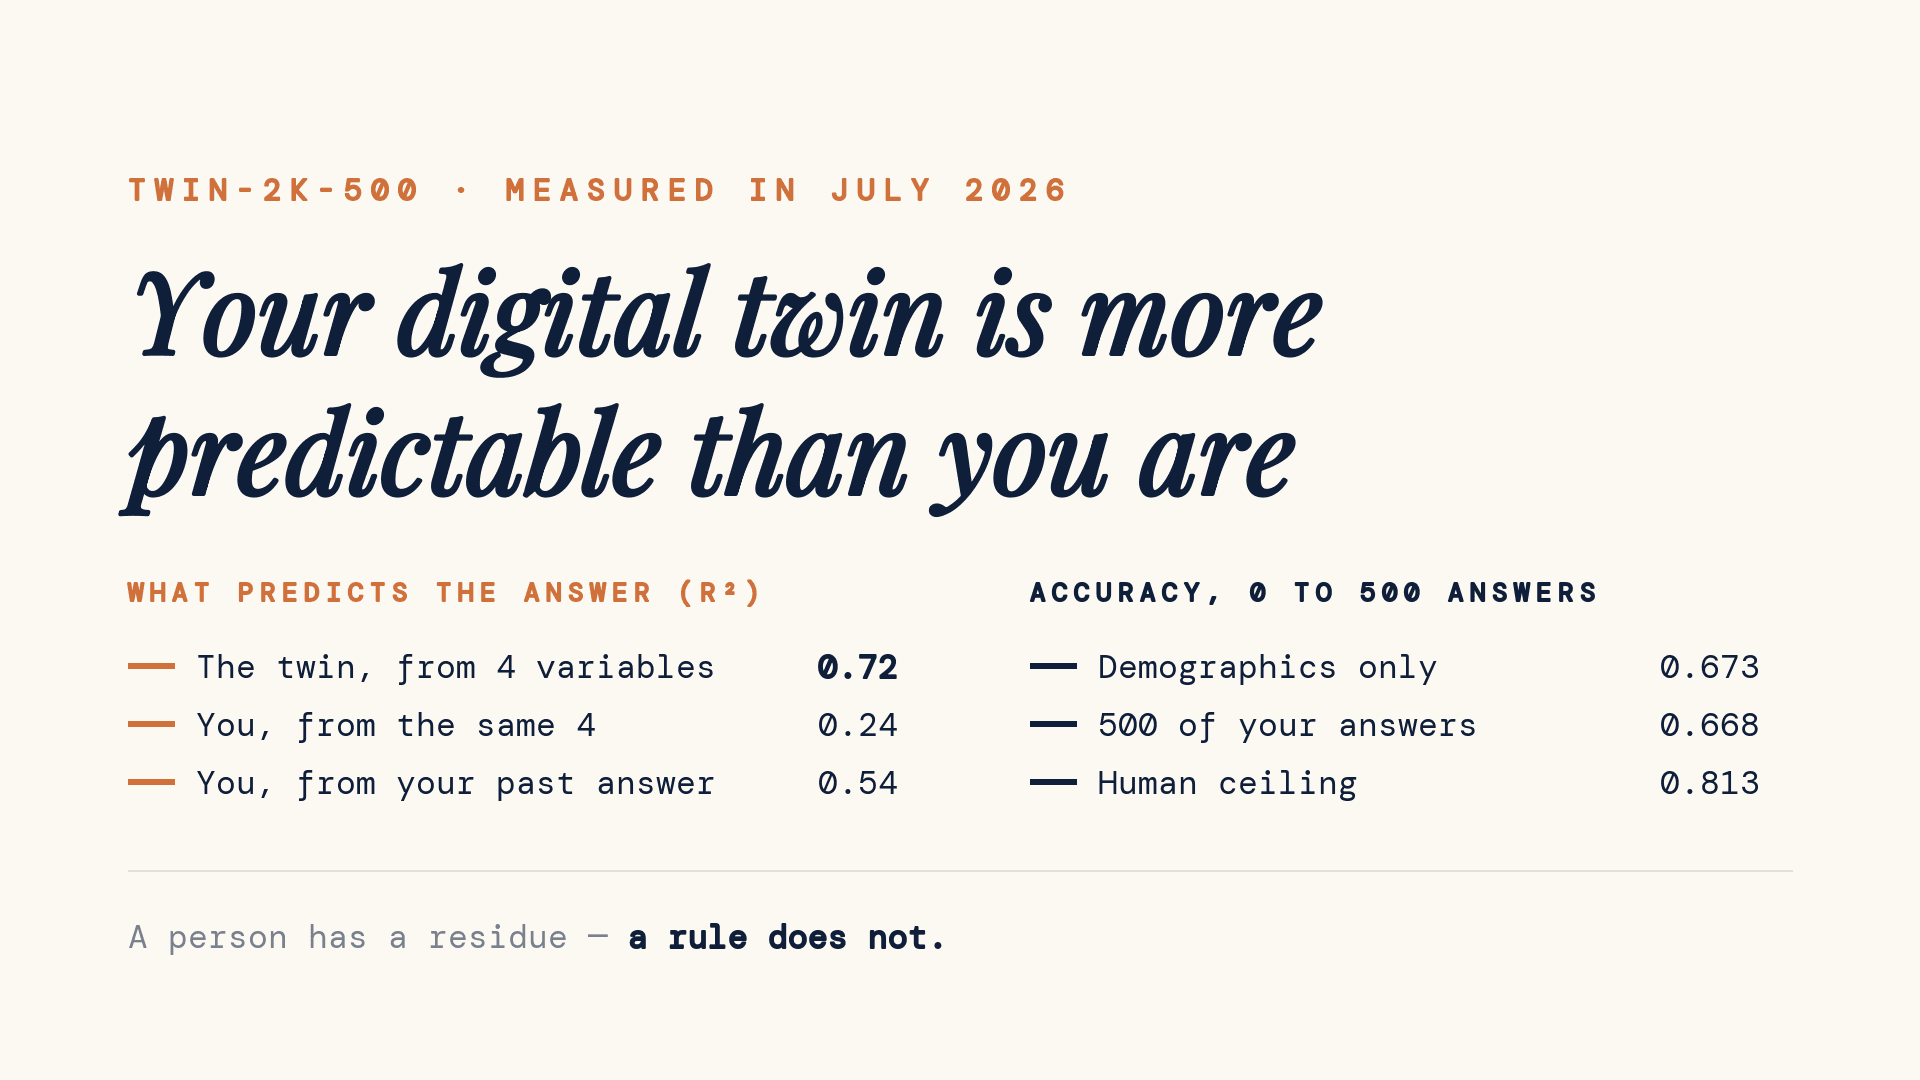
Four variables (party, ideology, religion, religious practice) predict the twins’ political attitudes at R² = 0.72. The same four predict the real people’s attitudes at 0.24.
On estimates of public support the gap is wider still: 0.70 for the twin, 0.03 for the people. For real people, their political profile says almost nothing about what they think others believe. For the twin, it says almost everything.
Add the other 60 measures and the twin hardly moves: on these two families, four variables give 96 to 97% of what the full profile explains about it. For the real people, the full profile itself only reaches 0.31 on attitudes.
More predictable than you are consistent
Ask a person the same question twice and you will not get the same answer twice. On these attitude items, a person’s own earlier answer predicts their later one at R² = 0.54. That is the usual ceiling for predicting a person: their own answer, asked again.
The twin’s answers are predicted from its profile at 0.75. On public-support estimates, 0.72 against a human ceiling of 0.28.
The twin is more predictable than the person is stable. A person has a residue. A rule does not.
To be exact about the comparison: both numbers are out-of-sample R², item by item, on the same people. One says how well a profile predicts the twin’s answer, the other how well a person’s earlier answer predicts their later one. It does not make the twin more stable, or more faithful, than the person. It says that a profile leaves much less of the twin’s answers unexplained than a person’s own past leaves of theirs. In people, that residue (mood, context, the article read that morning, a slightly different reading of the same words) is part of what a survey measures. A twin that leaves so little of it is not a sharper copy of the person. It is a different object.
It barely uses what is in front of it
The individual material is there, and it does little where it should matter most. Each person’s earlier answer to the very same item sits in the twin’s context. It predicts the twin’s answer at R² = 0.21 on attitudes, and between 0 and 0.03 on the other families. The person’s own answer is in front of the twin; the twin’s output follows the profile instead.
From zero to five hundred answers
The first study used the twins as published. The second held everything constant but one dial. For 100 people, on the same 29 items plus one more (a denominator-neglect question, 30 in all), the engine, the prompt template and the questionnaire stayed fixed. Only the block of the person’s own earlier answers changed, with k of them: 0, 10, 50, 100, 250, 500. At k = 0 the twin knows only demographics. Six hundred calls in all.
| Earlier answers in context (k) | Accuracy | Change from k = 0 [95% interval] |
|---|---|---|
| Human test-retest (ceiling) | 0.813 | |
| 0 (demographics only) | 0.673 | — |
| 10 | 0.674 | +0.001 [−0.022, +0.023] |
| 50 | 0.676 | +0.003 [−0.021, +0.027] |
| 100 | 0.676 | +0.003 [−0.021, +0.026] |
| 250 | 0.666 | −0.008 [−0.031, +0.016] |
| 500 | 0.668 | −0.005 [−0.028, +0.019] |
Accuracy here is the dataset authors’ own measure: one minus the error as a share of the scale, averaged within each task, then across tasks. No dose produces a detectable gain. From zero to five hundred answers, the change is −0.005, with a 95% interval from −0.028 to +0.019: even the upper end would close only about a seventh of the distance between demographics alone and the person’s own test-retest. With every item weighted equally, the twin given 500 answers is even slightly less accurate than the demographics-only one (−0.008, 95% interval −0.015 to −0.001).
Three other readings, on the same 100 people:
- Correlation with the person, across their 30 answers: 0.17 at k = 0 and 0.15 at k = 500, against a human ceiling of 0.60, so between 26 and 30% of the ceiling at every dose. The confidence intervals overlap (about ±0.055), so I do not claim a decline.
- Spread: the twins’ answers keep 65 to 72% of the human spread at every dose. Adding answers never restores the shape of the distribution.
- Political determination does fall with the dose. Averaged over the 30 items, the share of the twin’s answers explained by four political variables goes from 0.62 to 0.47 at its lowest (0.50 at 500). For the real answers of the same people, it is 0.04. Even at its lowest, the twin stays about twelve times more politically determined than a real person.
What the Columbia team published
On 2 September 2026, Science Advances published “Digital twins are funhouse mirrors: Five systematic distortions”, by Tianyi Peng, Melanie Brucks, George Gui, Daniel Merlau and colleagues, several of them authors of Twin-2K-500. The team that built the paradigm audited it, which is to its credit. A first version had been on arXiv since 23 September 2025, and its abstract already reported that rich individual data did not substantially improve the prediction of exact answers. The general result is theirs, and it came first.
Their design is far larger than mine: 19 pre-registered studies, 164 outcomes, 1,784 of the same people, twins conditioned on more than 500 answers each.
- Accuracy: 0.734 with an empty persona, 0.746 with demographics only, 0.748 with the full persona. The last two do not differ significantly (p = 0.37).
- Full-persona twins sit closer to demographics-only twins (mean absolute deviation 0.132) than to the humans they copy (0.252).
- Across the 164 outcomes, the twins’ average differed from the human one by 0.352 standard deviations on average, significantly so on 105 of them. The authors note that this error is comparable to that of the average of about ten real people.
- Five distortions: insufficient individuation, stereotyping, representation bias, ideological biases, hyper-rationality.
Their conclusion is that twins are best seen not as clones but as “hyper-rational, quasi-omniscient versions of humans”.
Where the two designs agree
Both point the same way: richer individual material buys little or no accuracy. Theirs compares three conditions across nineteen studies; mine varies the dose on one set of items. The items and the scales differ, so the levels cannot be compared, and mine is not a replication of theirs.
Their demographics-only twin is built on the same fourteen variables that, in the July numbers, already carry most of what a profile can predict about a real person. Seen from there, it is no surprise that it keeps up with the full twin.
Where their evidence is better
They find that the full persona does improve the correlation between twin and human, computed across participants, outcome by outcome: 0.197 on average, against 0.145 for demographics only. My headline correlation is a different statistic (within one person, across items) and it is flat. On their measure, my curve moves a little, from 0.28 at k = 0 to about 0.31 from k = 10 on. I computed no interval for that curve, and 100 people is a small sample; their 1,784 are the better evidence. Any sentence of the form “500 answers buy nothing” has to be confined to accuracy.
What the July work adds
Four July analyses do not appear in their paper in this form: the reduction of the twin to four variables; the comparison of the twin’s predictability with the person’s own test-retest; a dose-response from zero to 500 answers with engine and prompt held constant; and the weak link between the twin’s answer and the person’s earlier answer to the same item, sitting in its context.
What this means in practice
In these data, a digital twin behaves like a very confident average of people like you. At most, that makes it an exploratory first read on questions about groups, such as a direction or a comparison between broad segments, to be checked against real respondents, because its averages are often displaced. It should not be used for anything that depends on what separates a person from their neighbour: individual targeting, a named customer’s reaction, a personal forecast. In the dose-response, five hundred answers softened the political pattern a little. They did not bring the twin closer to the person.
So don’t throw the tool away. Stop asking it the one question it cannot answer, what will this particular person say, and ask every claim of individual fidelity to show its ceiling: the person’s own test-retest, on the same items.
Disclosure. FlashInsight sells synthetic samples. That is precisely why this discipline should be demanded first of those who sell them, us included.
Method over Magic.
Method
Data. Twin-2K-500, public: 2,058 US respondents, four waves. Outcomes: 29 wave-four items answered by the full sample (both studies), one denominator-neglect item (Study 2 only), and purchase propensity, the share of “yes” across 40 products at randomised prices (Study 1 only).
Study 1, run on 4 July 2026. Ridge regression, penalty chosen by inner cross-validation; out-of-sample R² from 5-fold cross-validation repeated four times; categorical predictors one-hot encoded; missing values imputed by the median within each fold. 64 predictors in six blocks; the economic block enters with four extra indicator columns for answers its scores could not capture (68 columns in all). Ceiling: the R² of the person’s own answer to the same item in waves 1 to 3. Variable importance by grouped permutation. Forward selection on z-scored family composites. Twins: the simulated answers published with the dataset (full persona of about 500 answers), generated by the dataset authors with GPT-4.1-mini.
Study 2, run on 6 July 2026. 100 respondents drawn with a fixed seed among those who answered at least 90% of the target items in both waves; 30 items. One engine, GPT-4.1-mini (the model behind the published twins), at temperature 0, with one prompt template; only the block of k earlier answers varies, over nested random sets, k = 0 being demographics only; 600 calls. The two ten-item matrices are numbered 1 to 10 in Study 2 and by their survey codes in Study 1; they are the same questions. Correlation, spread and political determination were computed on 6 July; accuracy was scored on the same outputs in August 2026; the accuracy intervals (10,000 paired bootstrap resamples of respondents) were added on 9 November 2026, without any new model call. Accuracy: 1 − |error| / scale range, averaged within each of the four wave-four tasks, then across tasks, as in the Twin-2K-500 paper. As a check, the same code gives the published twins 87.6% of the test-retest ceiling on these 100 people; the authors report 87.67% on the full sample. Weighting items equally instead gives 0.765 at k = 0 and 0.757 at k = 500, against a ceiling of 0.865 on that weighting. Correlation: answers z-scored item by item on the human wave-four distribution, Pearson r per person across the 30 items, averaged over people; bootstrap interval; test-retest ceiling 0.601 [0.563; 0.636]. Spread: ratio of standard deviations, averaged over items. Political determination: cross-validated R² of the answers on the four political variables, averaged over the 30 items.
Limits. One country. One engine for the dose-response. One hundred people in Study 2: enough to bound the change in accuracy, not enough to detect a modest gain in correlation. Linear models in Study 1. No new data was collected. Everything above can be recomputed from the public dataset and the deposited archive: scripts, derived tables, the 600 prompts and the 600 July outputs, with checksums.
How to cite
Florès, L. (2026). Your digital twin is more predictable than you are. Technical note and archive, Zenodo. doi:10.5281/zenodo.24090926. Analyses run on 4 and 6 July 2026. Readable version: https://www.flashinsight.io/blog/digital-twin-more-predictable-than-you
Sources
Peng, T., Brucks, M., Gui, G., Merlau, D. J., et al. (2026). Digital twins are funhouse mirrors: Five systematic distortions. Science Advances, 12(36), eaeh8260. doi:10.1126/sciadv.aeh8260. Preprint arXiv:2509.19088, first version 23 September 2025.
Toubia, O., Gui, G. Z., Peng, T., Merlau, D. J., Li, A., & Chen, H. (2025). Twin-2K-500: A data set for building digital twins of over 2,000 people based on their answers to over 500 questions. Marketing Science. doi:10.1287/mksc.2025.0262.
On FlashInsight. Synthetic personas vs digital twins · 85% of what? · Under-dispersion, and a test anyone can run.