 Dr Laurent Florès
Why Synthetic Personas Caricature Real People: What Pew’s Data Show About Silicon Sampling
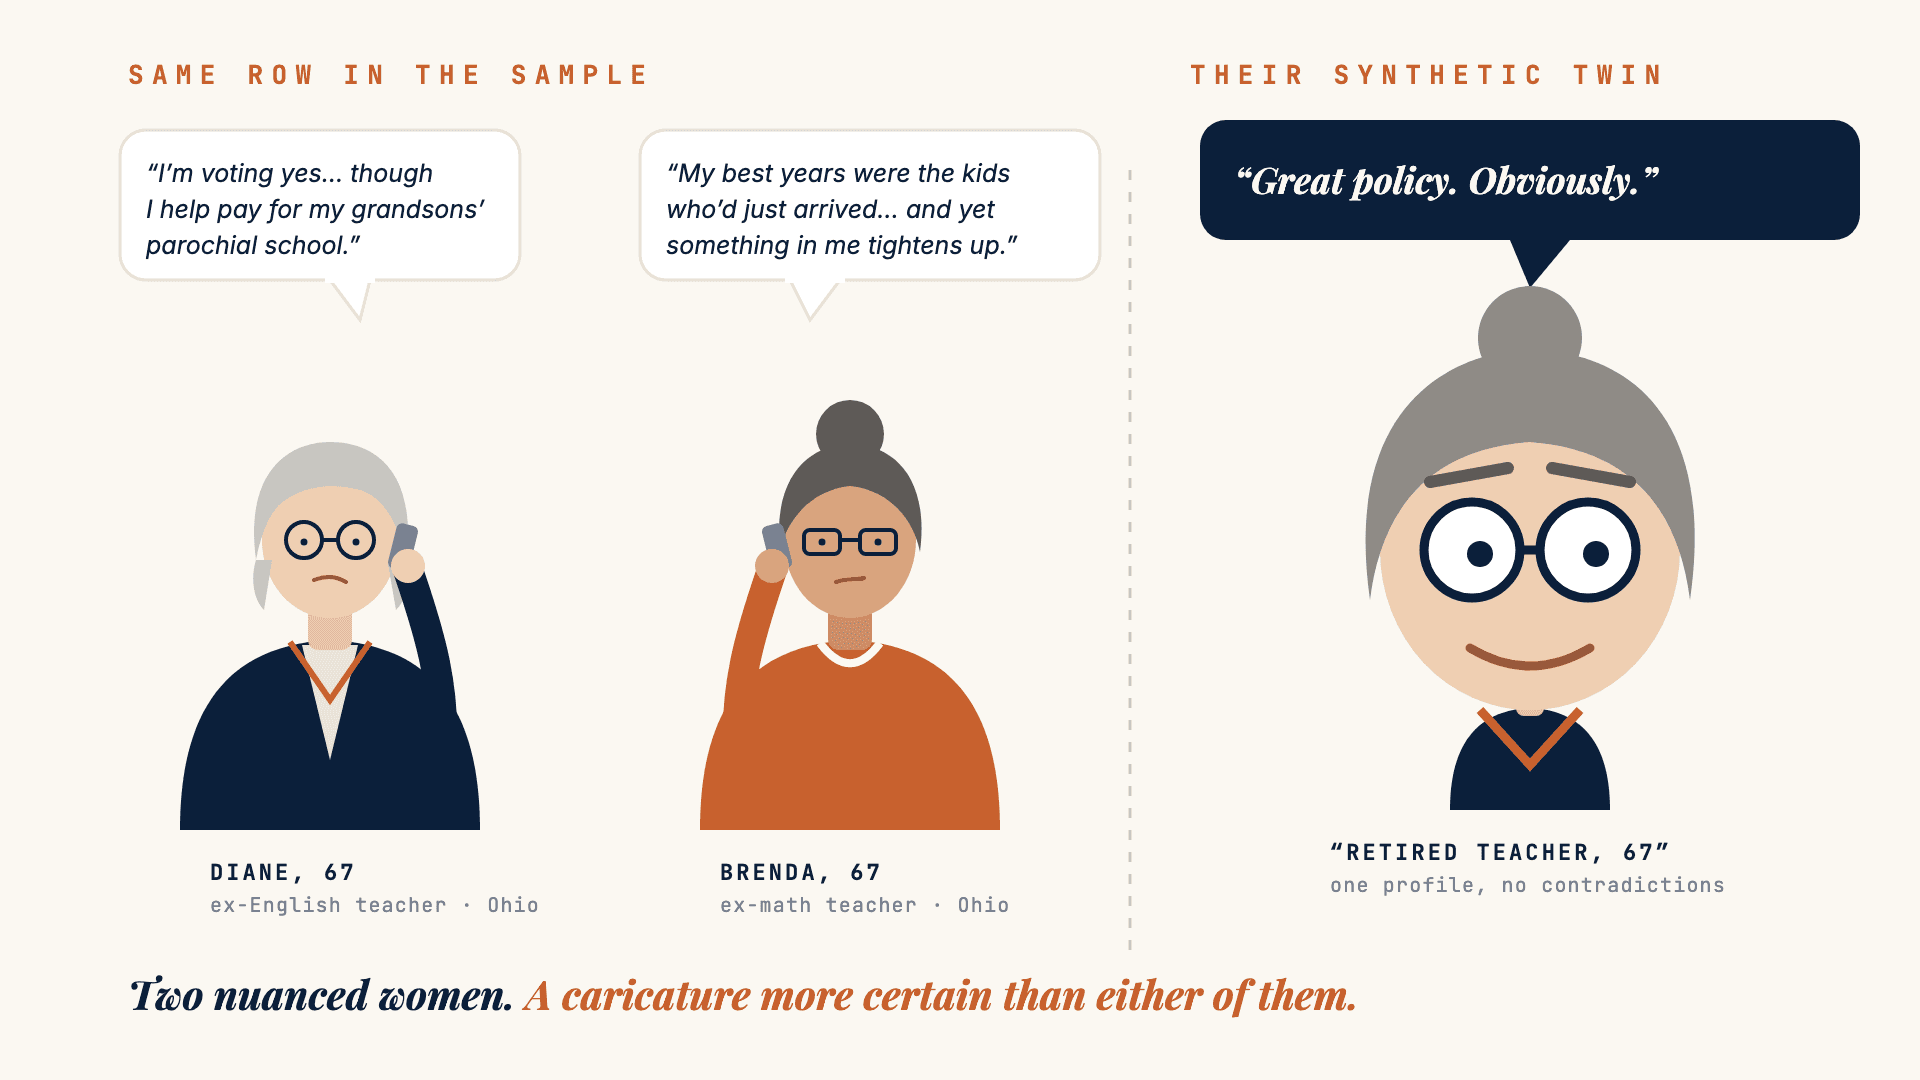
Diane and Brenda share one row in any sampling frame, and they do not share the same views. Their synthetic twin is more emphatic than either of them. Measured on Pew’s published data: opinions pushed away from the centre, disagreement cut by almost a third.
Two women with identical profiles disagree with each other, and each contradicts herself. Their synthetic twin does neither — and it is more emphatic than either of them. That is not an anecdote. On Pew’s published data it is a slope of 1.26 and a spread of 0.71.
Two retired teachers outside Columbus
Diane is 67. She taught English for thirty-four years in a public high school in Franklin County, Ohio. She has voted Democratic all her life. Master’s degree, retired, a daughter twenty minutes away.
Brenda is 67. She taught middle-school math for thirty-one years two districts over. She has voted Democratic all her life. Master’s degree, retired, a son in Cleveland.
In any sampling frame, that is one row. Same age, same sex, same state, same education, same occupation, same party. Build a synthetic persona from a profile and you get one profile for the two of them. That is where the trouble starts.
What they say to each other on the phone
— Did you see the school levy is back on the ballot?
— I’ll probably vote for it. Honestly though, Diane, my property taxes went up six hundred dollars this year and my pension went up nothing. At some point it’s enough.
— I’m voting yes. Although I’m the last person who should be lecturing anybody — my daughter put the boys in parochial school and I help with the tuition. So.
— At least you say it out loud. What gets me is the ones with the yard sign who drive their kids across the district line every morning.
— On that we agree. And the neighborhood — do you think it has changed?
— It’s changed, sure. Not necessarily for the worse.
— I don’t know. The best years I had teaching were the kids who had just gotten here. And at the same time I don’t recognize my own street any more, and something in me tightens up, and I don’t like that it tightens up.
Two women identical on paper. On the levy, one is for it and the other is for it and cannot afford it. On immigration, one is clear and the other holds two contradictory things without resolving them. And each acts against one of her own values — Diane pays private tuition while defending public schools, Brenda distrusts a district she gave thirty-one years to.
None of this is remarkable. It is the ordinary condition of a person.
Notice also what decides the conversation: a six-hundred-dollar tax notice and a grandson’s tuition bill. Neither variable exists in any sampling frame.
What their synthetic twin answers
Put the same question to a synthetic respondent built on that profile and you will get an answer. Put it to a second one, built on the same profile, and you will get close to the same answer. Both will be coherent, articulate, plausible. Neither will pay the tuition while finding itself unconvincing.
And the answer will be more emphatic than Diane’s and more emphatic than Brenda’s. Not at random — systematically.
That is not an impression. It can be measured.
The caricature, measured
At the end of September, the Pew Research Center published one of the most thorough public evaluations of synthetic respondents to date: one digital twin per real panellist, three waves of its probability panel, close to 300 questions. Average error, 12 points. Verdict: not really. We have read it in detail.
Pew is right, and the study is the best public evidence available. But the Center did something more useful still: it published the detail, question by question, option by option. Which means anyone can reopen the numbers and ask a different question from the one Pew asked.
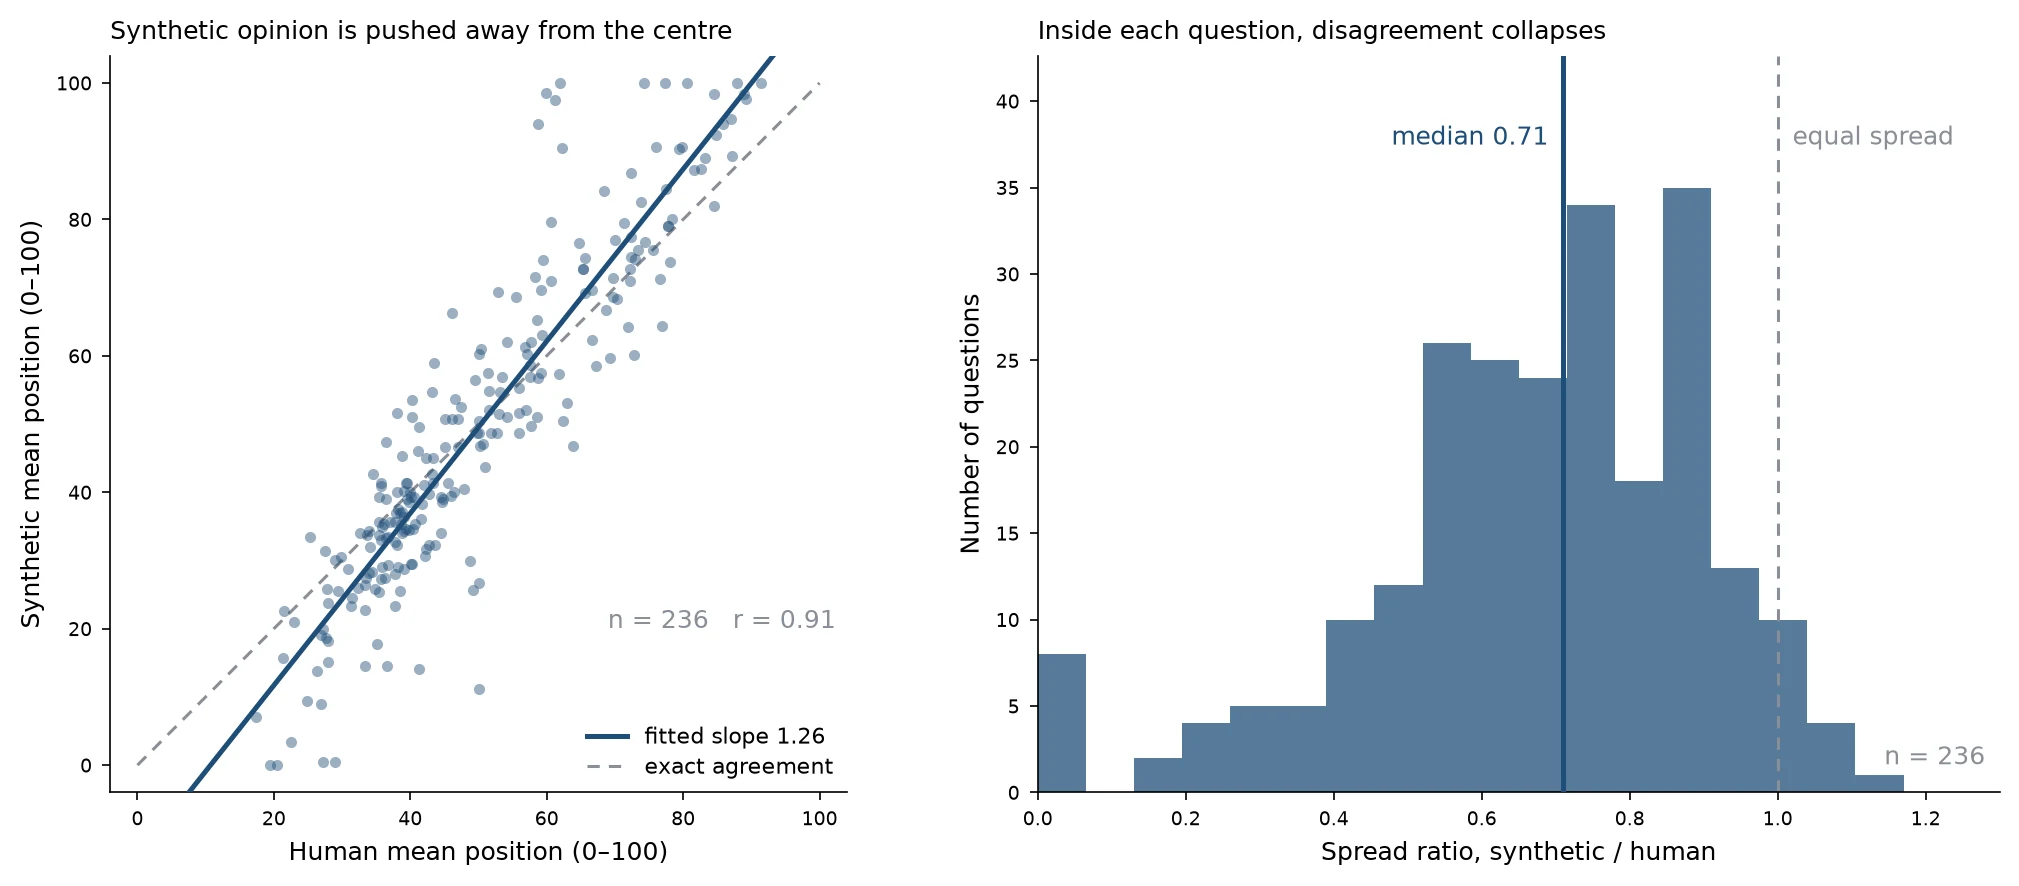
On the left, each dot is a question. If synthetic respondents were accurate, the dots would follow the diagonal. They follow a steeper line: 1.26. Whatever departs from the middle of the scale is pushed further out, and the pivot of that expansion falls at 51.8 out of 100 — the exact centre. Mean distance from the centre rises from 14.4 points among humans to 19.6 among synthetics. In 72% of questions, synthetic opinion is more emphatic than real opinion.
But the likeness holds: r = 0.91. The model knows perfectly well which way each question leans, and in what order the subjects rank.
On the right, the other half. Inside each question, disagreement between people evaporates: spread falls to 0.71 of the human value, and is lower in 97% of questions. Diane and Brenda resemble each other more than Diane and Brenda do.
Exaggerate what distinguishes, erase what nuances. That is the exact definition of a caricature — and it is why you recognise someone instantly in a newspaper cartoon, and why you cannot use one to fit them for a suit.
Nor is it a quirk of Pew’s setup. At Columbia, the team behind one of the largest digital-twin benchmarks measured its own technology: in 154 of 164 measures, the twins are less spread out than the people they copy. They call them funhouse mirrors. Same image, same diagnosis. The defect has a name, under-dispersion, and it is the one number vendors almost never publish.
Why the model does this
Because we ask it the wrong question, and it answers that one very well.
Given a profile and a question, it does not look for what this person would answer. It does not know her, and nobody knows her from six variables. It looks for what kind of person this is, and what that kind would answer. It produces an archetype — and an archetype has no contradictions, because it is made of the traits that define it.
An archetypal retired Democratic schoolteacher does not pay parochial tuition while defending public schools. Diane does.
The model is not under-informed about the person. It is over-confident about what the person implies.
This is also why enriching profiles fixes nothing, which surprised everyone, ourselves first. Adding variables does not hand the model a more real person; it hands it more traits to over-commit to. The Columbia team reached the same point: twins fed more than 500 personal answers did no better than demographics alone.
The same conclusion arrives from another direction, and from another continent. Chuyao Wang (2026, arXiv 2609.16395), working on Round 11 of the European Social Survey across 30 countries, finds that adding the country name alone to a three-variable backstory lifts the median per-item correlation from −0.03 to 0.52 — while richer profiles add no consistent gain, and recovery at the individual level stays negligible in every condition. The model answers with country-level assumptions, not individual attitudes.
What this means when you buy research
A caricature is excellent for two things and bad at a third, and the boundary is sharp.
It is good for recognising and for comparing.Which concept leads, which message carries, which segment is most receptive, which barrier outranks which. On the batteries in Pew’s questionnaire — which of these thirteen problems worries you most, which country do you view most favourably — the synthetic sample ranks items the way humans do, with a median correlation of 0.85 where two real samples of the same size would reach 0.98. Not perfect. Usable, and stated with its margin.
It is bad for measuring. A percentage from a synthetic sample is not a percentage: across the two-option questions in the Pew corpus, the mean gap on the majority share is 13 points. A spread, a share of extremes, a confidence interval computed on this are wrong in a direction known in advance.
There is a third category where nothing can be salvaged: everything that turns not on what people think but on what they know, have noticed, or are unaware of. The model answers as a fully informed population — 98% correct on a constitutional-law question where the real public scores 52%. And “don’t know” collapses from 18% to 7%. Diane and Brenda do not know everything.
One habit our industry should adopt
A single one, and it costs nothing: publish the ceiling next to the number.
A correlation of 0.85 against a human ceiling of 0.98 is information: you know what you are giving up. A correlation of 0.85 on its own is a sales argument. The difference between the two is, it seems to me, what the profession is entitled to demand of this market — and what it should demand first of those of us who make a living from it.
Taking Pew’s twelve points and concluding “it does not work” is a misreading. Announcing “90% correlation with humans” without saying on which quantity or against which ceiling is the symmetric error, and by far the more common one. The industry’s favourite figure is the textbook case: “85% accuracy” is not what it seems.
That is what we do for spread: we measure it against national surveys in eight markets, before and after correction, and publish the numbers.
Diane and Brenda are composites, assembled from people every one of us has taught, canvassed or interviewed. Neither is the caricature you would draw of her. You can still learn a great deal from a good drawing — provided you know that is what it is.
Method and sources
Figures attributed to Pew come from its report and topline of 30 September 2026. The figures in the chart come from a re-analysis of that same published topline, re-extracted and checked line by line against the source: 284 of 287 items identical to the raw topline, the remaining three being documented manual repairs that were independently reproduced.
The chart covers the 236 questions carrying an ordered scale of at least three points; mean position is computed over the substantive scale options, excluding “no answer” and off-scale options such as “not sure”, placed on a regular 0–100 support. Option order was verified item by item: eighteen option sets in the topline place the middle category in the last column, where a mean computed on column order would be wrong.
One technical note, since a slope above 1 invites it: measurement error on the horizontal axis attenuates a slope rather than inflating it. Here the human positions are means over 3,400 to 6,700 respondents, so the attenuation is negligible — and if it mattered, 1.26 would be an underestimate.
The analysis is exploratory and was not pre-registered. It describes one model on one corpus: Pew shows in its own model-comparison chapter that a different model renders the public more extreme than reality where this one renders it more centrist. Variance compression is not a law of nature; it is a property to be re-established with every change of model.
- Chapekis, Lau, Bestvater, Shah, Mercer & Smith (2026). Can AI Stand In for Human Survey-Takers? Not Really. Pew Research Center, 30 September 2026. pewresearch.org
- Comparison of human and AI-generated survey results— comparative topline, 56 pages, the source of every figure re-analysed here. pewresearch.org (PDF)
- Wang, C. (2026). Silicon sampling answers with country-level assumptions, not individual attitudes: Cross-national evidence from the European Social Survey. arxiv.org/abs/2609.16395
- Peng, T., Gui, G., Brucks, M., Toubia, O. et al. (2026). Digital Twins as Funhouse Mirrors: Five Key Distortions. Science Advances. arxiv.org/abs/2509.19088
Frequently asked questions
Are synthetic personas reliable?
For comparing, partly: on Pew’s published data they get the direction of a question and the order of options right. For measuring, no: their percentages are off by 12 points on average, their opinions are too emphatic, and disagreement between people shrinks to 0.71 of its real value.
Why do synthetic respondents caricature real people?
Given a handful of variables, the model does not simulate a person: it answers as the archetype of that profile. An archetype has no contradictions, so the model exaggerates what separates groups and erases what nuances individuals.
What did Pew find about silicon sampling?
Pew had a digital twin of each panelist answer close to 300 questions from its probability panel. The average error was 12 points, and Pew concluded that AI cannot stand in for human survey-takers. Its published topline also lets anyone measure the caricature: a slope of 1.26 and a spread of 0.71.
When can a synthetic sample be used?
To explore, compare and rank: which concept leads, which message lands, which barrier weighs most. Not to report a percentage, a share of extremes or an awareness level, and not for a decision that hinges on a threshold.