Aaru and Simile on validation: what they showed, and the number still missing
Within a month, two of the most closely watched simulation companies published real evidence. Aaru measured itself against surveys repeated on themselves and against actual purchases; Simile built a model that predicts its own errors. Here is what they showed, what neither has measured yet, and what we do, on a much smaller scale, in the open.
In the space of a month, two of the most closely watched companies in synthetic research published serious evidence about their own accuracy. Both deserve to be read in full, and we link to them below. Read together, they point to the same place: the value lies less in generating answers than in measuring how far those answers can be trusted. What neither has published yet is the figure a buyer needs once results are broken down by segment.
Key takeaways
- Aaru compares its error with how much real surveys disagree with themselves, and lands inside that range: 7.62 points of total variation distance across 2,993 questions.
- Aaru also checked itself against actual purchases, and ranked brands closer to card transactions than the published surveys did: 92.4% of brand pairs, against 77.8%.
- Simile and Aaru both predict their own errors, question by question. That is a real advance.
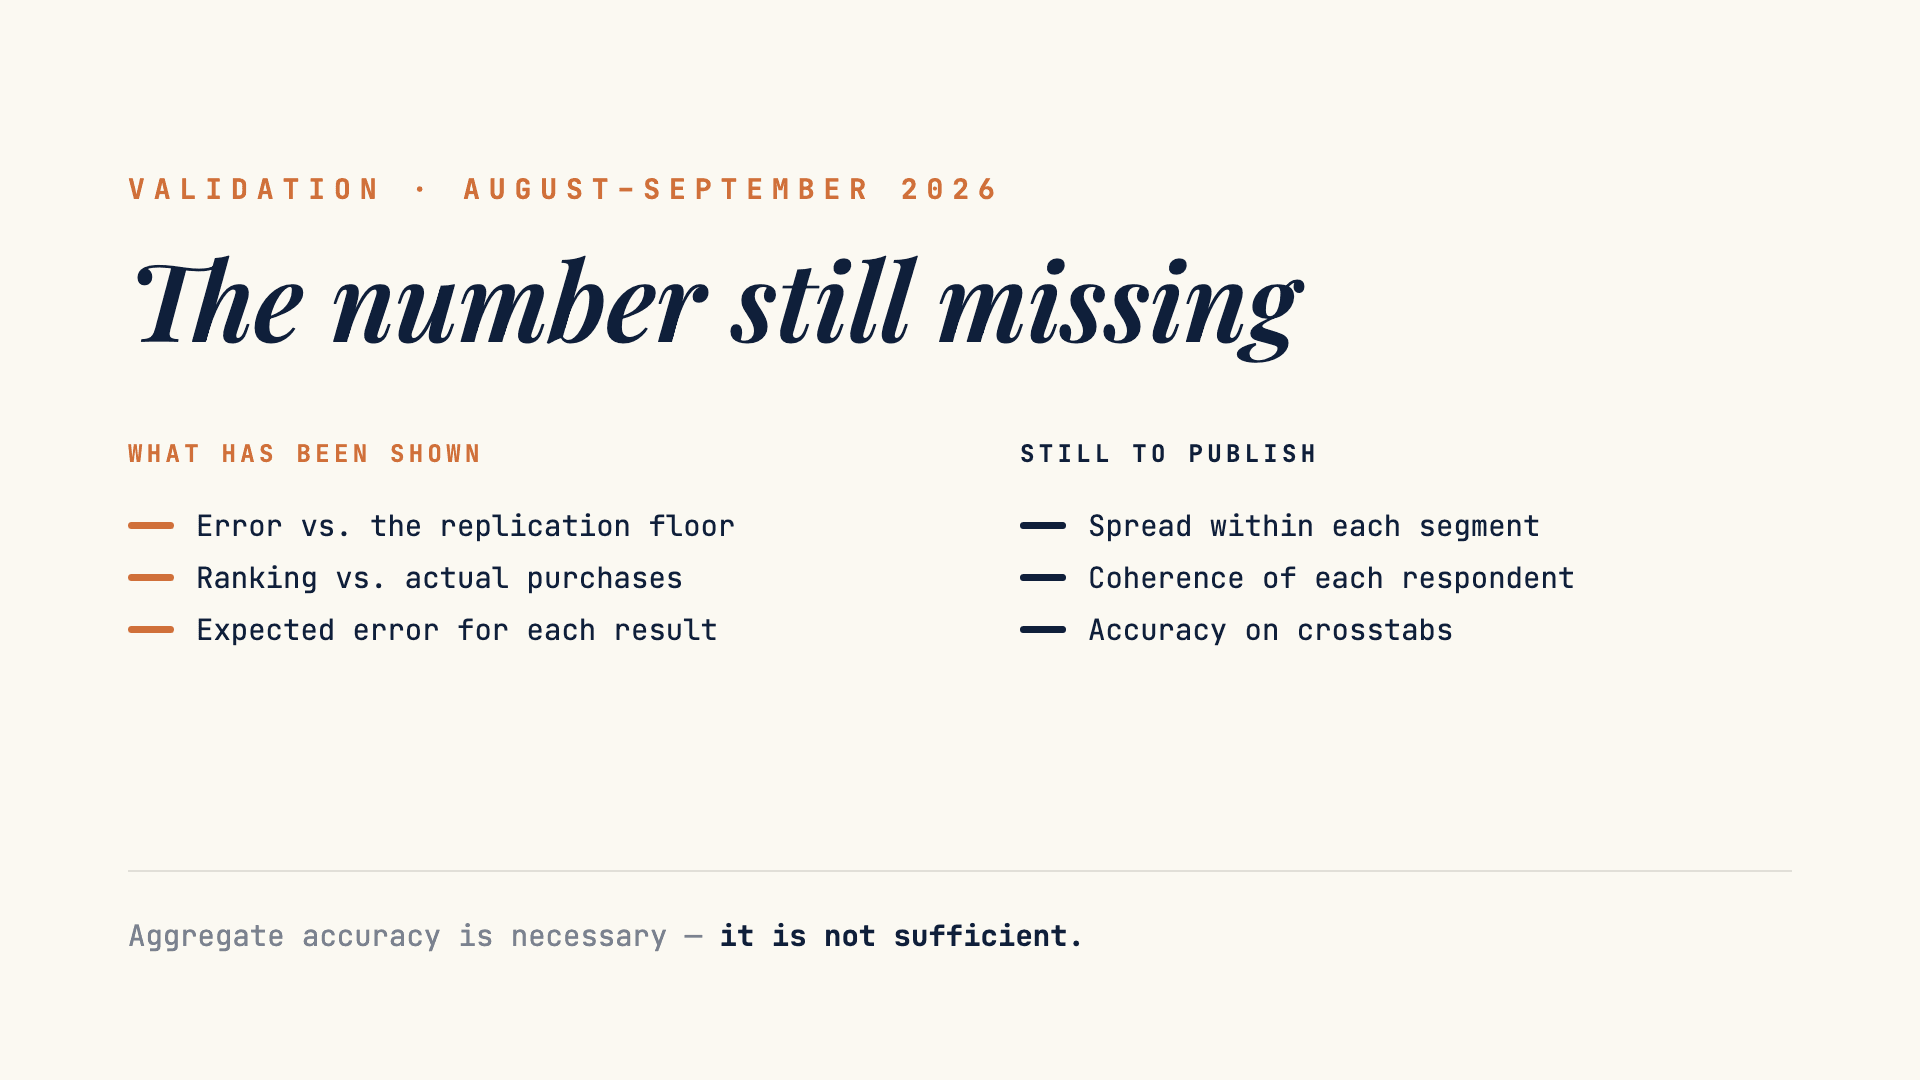
- Both measure answer shares one question at a time. Neither has yet published whether their simulated respondents disagree with each other as much as real people of the same profile do.
- We work on a far smaller scale, and differently: we publish what we measure, against which surveys, where we fall short, and tests anyone can run.
What Aaru showed
Aaru’s evaluation, published on 24 September 2026, covers 2,993 questions, 13,727 answer shares, 186 studies and nine industries. Its headline is a mean total variation distance of 7.62 points between simulated and published answer distributions, 5.98 once sampling noise is taken out, with a Pearson correlation of 0.970.
The number matters less than the yardstick. Rather than claiming accuracy in the abstract, Aaru compares its error with the replication floor: how much two real surveys disagree when the same questions are asked again. Published work puts that between 2.3 and 12 points. Their own sentence is the best summary:
The replication floor is the bar simulations must clear before they are allowed to say anything new.
Three further things stand out.
- Behaviour, not only opinion. Against a panel of card transactions, the simulation ranked 92.4% of 340 brand pairs in the same order as actual purchases. The published surveys on the same brands managed 77.8%. Checking a simulation against what people did, rather than against another survey, is a hard test, and a rare one.
- Predicting its own errors. For each question the system announces how far off it expects to be. Keeping only the more confident half brings the average error down from 7.62 to 4.54 points.
- Guarding against contamination. The questions come from studies fielded in 2026, external search is limited to pages saved before fieldwork, and the core model is not a language model. They also publish both the raw and the adjusted error, and keep negative adjustments rather than rounding them up to zero.
Aaru also sets its figure beside published research on the same metric, noting that those studies used different questions and populations: 19.1 points for the best SimBench result, 14.6 for Meister and colleagues, 17.1 for SYN-DIGITS. And on two samples of 500 of its questions, asking an open model directly for the answer distribution did markedly worse: 12.4 points for Kimi K3 on a random sample, 16.5 on a harder one.
What Simile showed
Simile’s post of 25 August 2026, signed by Andrew Wesel, Sarah Chen and Percy Liang, addresses a question every buyer asks: when can I trust this particular result? Their answer is a confidence model that predicts, for each simulated question, how far the output is likely to be from the real distribution.
It is evaluated on about 8,600 questions held out from training, with folds built so that a question and its sample never leak across. What counts as a decision-quality result, an error below 0.16, comes from an internal exercise in which fourteen Simile raters judged about 2,750 distributions, with substantial agreement between them; the team expects that definition to evolve. The best version separates good from poor results with an AUROC of 0.736. Simile adds, on its site, that it runs over 7,000 evaluations across subpopulations every week against real people.
Aaru reports a higher figure for its own confidence predictor, 0.845 for errors below 16 points, and sets it beside Simile’s. It says so itself: the two come from separate evaluations, with different questions, sizes and calculations. Read it as two teams converging on the same idea, not as a head-to-head result.
Simile grew out of the Stanford research behind the study often quoted as “85% accuracy”. We explained in 85% of What? why that figure is a relative benchmark, 85% of the consistency people manage with themselves, and why that is the more honest way to state it. The replication floor is the same kind of idea, applied to whole surveys.
Where they converge
Read side by side, the two publications point to three ideas we think the whole field should adopt.
- Accuracy is only meaningful against a human reference: how much people disagree with themselves, not a perfect score.
- Every result should come with its own expected error, so that a buyer knows where to trust it and where to check.
- The value is in the measurement layer. Generating plausible answers is becoming easy; knowing how far they can be trusted is not. That is the argument we took up in Calibration, and what a buyer can check.
The number still missing
Both publications measure answer shares, one question at a time. Aaru states the scope plainly: this evaluation covers the distribution of each answer, and future posts will cover higher-order accuracy and row-level coherence. That is a fair boundary to draw, and it points at the next question.
A simulation can match every answer share and still produce respondents who are too alike inside a segment. The averages stay right; the differences between groups, and the minority who disagree, shrink. We call this under-dispersion. We found it in our own engine, which is how we know how easily it hides: every average we checked was already correct.
Aaru writes that crosstabs and segments are “predicated on aggregate accuracy”. True: aggregate accuracy is necessary before any segment can be read. It is not sufficient. A buyer who splits results by age, region or attitude needs a second figure, the spread within each group compared with real people of the same profile. We look forward to reading theirs.
What we do, on a much smaller scale
FlashInsight is not in the same league on resources, and this is not a competition. We are a small team, led by a researcher with thirty years in insight. What we try to do is different: understand the problem, publish what we find, and give others the means to check it and to do it themselves.
- We calibrate against named public surveys. Round 11 of the European Social Survey for five European markets, the World Values Survey for the United States and Mexico, and a national survey of 1,016 respondents in Morocco.
- We publish the missing number for ourselves. Across eight markets, our simulated respondents showed 0.20 to 0.76 of human disagreement before correction, and 0.85 to 1.07 after. The full table is in How reliable are synthetic respondents?
- We publish our defects. We reported under-dispersion in our own panels before we had fixed it, and the audit of our public claims turned up three that were not true.
- We publish tests, not only results. Our dispersion test runs on published data and costs nothing. Anyone can run it on us, or on any other supplier.
We also say where we stand. We have no behavioural validation against purchases, which is where Aaru is ahead. Our reliability index already scores every production sample, but it does not yet score dispersion, and it does not predict the error of each individual result. We are working on the two things they have both led on: an expected error for each result, and a validation on new questions, run once, under a protocol registered in advance. Neither is finished. We will publish both when they are further along, whatever they show. What we have today is a correction that holds against the surveys it was calibrated on. That is progress, not proof.
It is a question of time. We have not raised hundreds of millions of dollars, and we do not work to a funding round’s calendar. We do this because we enjoy it, to move our own thinking forward, and that of everyone who wants people to stay at the centre of this work: those who design the studies, read the answers, and remain accountable for the decisions that follow.
What a buyer should ask
Of any supplier, including us:
- Your error, compared with how much real surveys disagree with themselves. Aaru has set a useful initial bar here.
- Whether each result comes with its expected error, and how that estimate was checked.
- Whether the test questions were seen while the system was being built or tuned.
- The spread within each segment, compared with real people of the same profile. Neither publication covers it yet.
- Whether you can run a test yourself, on your own questions, and see the individual answers.
Our invitation stands: any organisation willing to run a concept test in parallel, theirs on real respondents and ours synthetic, blind to the end, is welcome. We will share the protocol and publish the result, whatever it is. Everything else we have measured is on our Evidence page.
Frequently asked questions
How accurate is Aaru?
In its September 2026 evaluation, Aaru reports a mean total variation distance of 7.62 points between its simulated answer distributions and published survey results, across 2,993 questions from 186 studies in nine industries (5.98 after adjusting for sampling noise), with a Pearson correlation of 0.970. That places it within the range of disagreement published for real surveys repeated on themselves. The evaluation covers one question at a time; Aaru says higher-order accuracy and row-level coherence will be covered in future posts.
What is the replication floor?
It is the amount two real surveys disagree when the same questions are asked twice. Aaru uses published studies that put it between 2.3 and 12 points of total variation distance. The idea is that a simulation should first be judged against how much people disagree with themselves, not against a perfect score no survey achieves.
How does Simile measure the confidence of a simulation?
Simile trains a model that predicts, for each simulated question, how far the result is likely to be from the real distribution. In its August 2026 post, the best version separates good from poor results with an AUROC of 0.736 on about 8,600 held-out questions. Simile also states on its site that it runs over 7,000 evaluations across subpopulations, weekly.
What have Aaru and Simile not published yet?
How much their simulated respondents disagree with each other within a group, compared with real people of the same profile. Aggregate answer shares can be right while segments are too uniform. Aaru states that higher-order and row-level accuracy will be covered in future posts.
How does FlashInsight validate its synthetic respondents?
On a much smaller scale. We calibrate against named public surveys (European Social Survey round 11, World Values Survey, a national survey of 1,016 respondents in Morocco) and publish a dispersion ratio for eight markets: 0.20 to 0.76 of human levels before correction, 0.85 to 1.07 after. We publish the test so anyone can run it. Our reliability index scores every production sample; we are working on an expected error for each result and on a validation on new questions under a protocol registered in advance. Neither is finished. We have no behavioural validation against purchases.
Method over Magic.
Sources
Aaru. Population simulation at the replication floor, 24 September 2026, and the full methodology.
Simile. Andrew Wesel, Sarah Chen and Percy Liang, Building confidence in Simile, 25 August 2026; validation statement on simile.com.
Our notes. 85% of What? · Calibration, and what a buyer can check · How reliable are synthetic respondents? · Under-dispersion, and a test anyone can run